Small-caps have been leading the charge for the past few weeks, so MoneyShow’s Tom Aspray studies the charts of four small-cap stocks with bullish volume patterns to see if they’re likely to be higher by the end of the year.
The FOMC announcement had few surprises though some saw hints that that improvement in the economy could mean they will move rates higher than expected. The losses were minor as the oil service, banks, and semiconductors were able to move higher.
Though most of the Asian markets were higher, the selling overseas is fairly strong with the German Dax down over 1.3%. The futures are just barely higher ahead of the 3rd quarter GDP data—which came in at 3.5%—which was above estimates of 3.1%.
For the past few weeks, the small-caps have been leading the charge and, as I pointed out in yesterday’s October 17 Buy Signals Get Stronger, the technical studies on IWM have broken through major resistance.
There are quite a few small-cap stocks that have been doing much better than the overall market and these four are characterized by very bullish volume patterns.
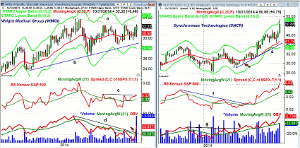
Chart Analysis: Wright Medical Group (WMGI) is a $1.6 billion medical orthopedic company.
- It closed last week above the quarterly pivot at $30.52.
- It is up 5.24% YTD and is testing the year long downtrend, line a.
- The weekly starc+ band is at $13.51 with upside targets from the flag formation (lines a and b) in the $39-$40 area.
- The relative performance has been above its WMA since early September.
- There is key resistance for the RS at line c.
- The volume this week has been the highest of the past seven years.
- The weekly OBV has broken its downtrend, line d, and is well above its WMA.
- The rising 20-day EMA is at $31.23 with the week’s low at $30.26.
Synchronoss Technologies (SNCR) is a $2.1 billion tech company that provides cloud solutions and communication software.
- It has had a great year, up over 63% YTD, but the volume keeps pouring into the stock.
- The weekly starc+ band has been tested this week with the quarterly projected pivot resistance at $56.07.
- SNCR closed at $33.35 in June, which was above the 2nd quarter pivot level.
- The 4th quarter pivot at $41.59 was tested but held during the recent correction.
- The weekly relative performance broke its downtrend, line f, in June and will close the week at another new all time high.
- The OBV completed its bottom formation at the end of June just as SNCR closed above its 20-week EMA.
- The daily OBV (not shown) also looks strong and has also confirmed the new highs.
- With the surge over the past two days, the first real support is at $47.81 with the 20-day EMA at $45.99.
NEXT PAGE: Two More Small-Cap Stocks to Watch
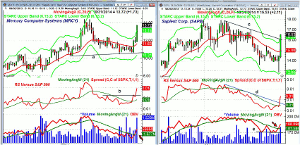
|pagebreak|Mercury Computer Systems (MRCY) is a $0.5 billion provider of specialized processing subsystems.
- The stock is up $25.32 YTD and is trading well above the weekly starc+ band at $13.14.
- The preliminary monthly projected pivot resistance for November is at $15.86.
- Just three weeks ago, the major support, line a, in the $10.60 area was tested.
- The weekly RS line completed its bottom formation in the middle of October as the resistance at line b was overcome.
- The volume has been heavy this week as the OBV has moved well above its WMA.
- The daily (OBV) (not shown) has also made significant new highs.
- MRCY gapped higher Wednesday opening at $12.67, which was well above the Tuesday high at $12.10. This gap is first support.
Sapient Corp. (SAPE) is a $2.3 billion global services company that is now trading above the weekly starc+ band at $16.26.
- The weekly downtrend, line c, has been overcome.
- There is next resistance at $17.00 with stronger at $17.89.
- The weekly RS line has also moved through its downtrend, line d.
- The weekly OBV appears to have completed its short-term bottom formation, line e.
- The OBV has moved well above its WMA as this week’s volume has already been the heaviest since May.
- The ranges over the past two weeks have been wide as the weekly starc- band at $12.85 was approached two weeks ago.
- There is first support at $15.46 with the 20-day EMA at $14.59.
What it Means: All four of these stocks are likely to be higher by the end of the year but all—except Wright Medical Group (WMGI)—are clearly overly extended right now.
It would require a pullback or some consolidation in prices to chase those that are trading above the weekly starc+ bands.
How to Profit: For the Wright Medical Group (WMGI) would go 50% long at $31.18 and 50% at $30.66 with a stop at $29.37 (risk of approx. 5%).


