Since the gold market suffered again, it's not a bad idea to revisit MoneyShow's Tom Aspray's scenario for what approach gold owners should use to reduce their gold exposure. Here's an updated look at the monthly, weekly, and daily charts to see how this strategy has worked out.
Thursday's early stock market strength sent more of the bears running for cover and-despite the afternoon selloff on new Ebola fears-the markets closed strong. The Dow Transports were up over 2%. The small-caps also did well as the Russell 2000 was up 1.8%.
The market internals were better than three-to-one positive and the weekly NYSE Advance/Decline line is close to moving back above its WMA. The financial media has switched their end of the world opinion from last week and have now concluded the correction is over. This makes a correction likely by the middle of next week.
The gold market suffered again as the December futures were down 1.28%. Some recent data suggests that the hedge funds are the largest holders of the popular gold and gold mining ETFs. This could mean more pain for the hedge fund, which suffered last week.
In my September 25 column, 3 Things Gold Owners Should Know, I outlined a scenario for what approach gold owners should use to reduce their gold exposure. An updated look at the monthly, weekly, and daily chart reviews how this strategy has worked out.
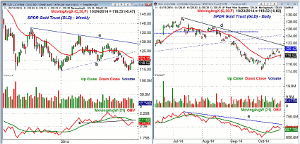
Chart Analysis: The SPDR Gold Trust (GLD) is now up just 2.07% YTD as it has dropped 11.3% from its early 2014 high.
- The weekly chart shows that the uptrend, line b, was broken in early September.
- Then completed the triangle formation (lines a and b), which has downside targets in the $98-$102 area.
- GLD came close to its declining 20-week EMA this week, which is now at $121.13.
- A weekly close below last week's low of $117.53 is likely to trigger heavier selling.
- The weekly chart shows that more important support now stands at the early October low of $114.42.
- So far, the volume this week has been light and a weekly volume of over 40 million shares, with a lower close, would be more negative.
- The OBV peaked in early July as it had been acting stronger than prices.
- The drop below the OBV support, line c, and the declining WMA are negative.
The daily chart of the SPDR Gold Trust (GLD) shows that the quarterly pivot at $120.42 has been tested over the past week. This is just above the 38.2% Fibonacci resistance at $120.02.
- The 50% retracement resistance stands at $121.78.
- GLD has rallied over 5% from the October 3 low of $114.42.
- The volume Thursday was the highest for the week but still below last week's levels.
- The daily OBV has turned lower as, so far, the rally has failed well below the downtrend line
- The daily chart has short-term support now at $117.17, which was the October 10 low.
- There is additional daily chart support in the $116 area.
NEXT PAGE: Two More Gold ETFs to Watch
|pagebreak|The negative outlook on the Market Vectors Gold Miners (GDX) was discussed in the August 26 column More Pain or Gain for the Miners? and GDX has dropped over 21% in the interim.
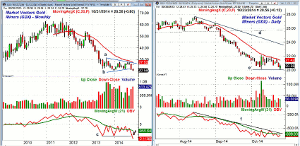
- GDX is now down 2.70% YTD and has dropped 22.4% in the past three months.
- The monthly chart shows that the continuation pattern (lines a and b) was completed with the September close.
- The close below support (line b) has targets in the $12-$15 area.
- The volume this month has been higher than September even though the range has been tight.
- The monthly on-balance volume (OBV) shows a pattern of lower highs and closed below its WMA last month.
- The major OBV support (line c) will likely be violated this week.
- This would be consistent with a drop well below the December low of $20.18.
The daily chart of the Market Vectors Gold Miners (GDX) more clearly shows the weak nature of the rally from the early October lows, line e.
- The rally in GDX failed well below the quarterly pivot at $23.47.
- The declining 20-day EMA has been tested several times and is now at $21.42.
- The daily continuation formation is just over $2 wide so a decisive closing break of the $20 level has initial targets at $18.
- The monthly projected pivot support for October is at $18.03.
- The daily OBV is holding above its recent lows, which does allow for a short-term rebound.
- It is still below its WMA and the downtrend, line f.
What It Means: In the September column, I presented these three things that I thought gold owners should know.
- The high level of bearish sentiment does make a rebound likely in the next several weeks.
- Owners should realize that the next downside targets are 2-5% below current levels and these levels could be tested before we get a rebound.
- Those who want to sell their longs should monitor the 20-day EMA as a resistance level for selling.
GLD did drop another 2% before its 5% rally above the 20-day EMA. I continue to feel that this rally provided a good opportunity to close out long gold positions or hedge them. Though the rebound could go further and last a bit longer, I still think "the risk on the long side, for now, is currently high."
How to Profit: No new recommendation.


