Many ETFs continue to have weekly closes below their quarterly pivots, so MoneyShow's Tom Aspray takes a technical look at four ETFs to see if it will take a stronger rally for them to have weekly closes back above their key pivot levels.
The ability of the market to continue on the upside Monday was a positive sign as the market internals were considerably stronger than they were last Friday. The A/D lines for the four major ETFs have improved as they have moved above the first levels of resistance.
With two consecutive days on the upside, Tuesday's close may be pivotal. Strong earnings after the close from Apple, Inc. (AAPL) and Texas Instruments (TXN) should help to offset the negative numbers from International Business Machines (IBM).
The EuroZone markets are higher in early trading despite the report that the Chinese economy grew at the slowest rate in five years. The US futures are also sharply higher. For the Spyder Trust (SPY), the 50% retracement resistance stands at $191.90 with the 20-day EMA at $192.35 and these are the next key levels to watch.
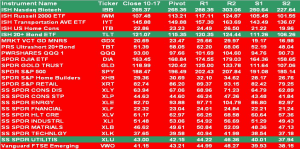
The majority of ETFs that I track continue to have weekly closes below their quarterly pivots. Some of the weakest sectors have been below their pivots since the 3rd quarter. It will take a much stronger rally for them to have a weekly close back above their key pivot levels.
Only the Sector Select SPDR Utilities (XLU) and the iShares 20+ Year Treasury Bond (TLT) have been above their quarterly pivots all quarter. The iShares Nasdaq Biotechnology (IBB) just closed back above its pivot last Friday. All three are highlighted in green.
The rest of the ETFs are negative basis the quarterly pivot analysis and they are highlighted in red. It is also important to keep track of both the quarterly support (S1 and S2) as well as the resistance (R1 and R2). As I have pointed out in past articles, rallies and declines often stop at these levels.
I have chosen four ETFs where I will review in detail their past quarterly pivot signals.
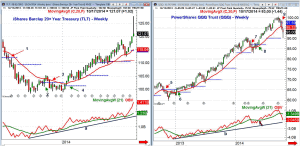
Chart Analysis: The iShares Barclay 20+ Year Treasury ETF (TLT) had a wide range last week as the move in yields last Wednesday was unprecedented. It is well above its quarterly pivot (QP) at $115.35.
- Starting in the 2nd quarter of 2013, the weekly close on May 24, 2013, (point 1), TLT closed below its QP.
- In mid-October 2013, TLT closed back above its pivot (point 2) but this signal was reversed just three weeks later, point 3.
- The first week in 2014, TLT closed at $102.08, which was above its 1st QP of $101.29, point 4.
- This signal has stayed in effect all year though it traded below the 3rd quarter pivot at the start of July but did not close above it.
- Last Wednesday's high at $127.68 was well above the quarter R2 level at $124.44.
- The weekly on-balance volume (OBV) has surged sharply over the past four weeks.
The Powershares QQQ Trust (QQQ) has been one of my favorite ETFs for some time as it was a market leader based on the relative performance analysis. It closed Monday at $94.39, which is well below the quarterly pivot at $97.66.
- On October 12, 2012, QQQ closed below its quarterly pivot, point 5.
- This signal stayed in effect until the start of the 1st quarter of 2013 (point 6).
- The QQQ tested its quarterly pivot several times in 2013 but stayed up above it until the start of the 2nd quarter of 2014 (point 7).
- This was during the 8.6% correction from high to low that lasted seven weeks.
- On Friday, October 10, QQQ closed at $94.44, which was well below the quarterly pivot at $97.66.
- The weekly OBV moved back above its WMA one week after the QQQ closed back above its QP.
- The OBV did confirm the recent highs but has now dropped well below its WMA.
- The OBV has long-term support at line b.
Next Page: Two More ETFs to Watch
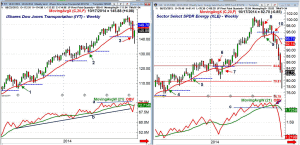
|pagebreak|The iShares Dow Jones Transportation (IYT) has also been a stellar performer for the past few years as it also has been a market leader. It closed Monday at $147.29 with the quarterly pivot at $149.88.
- IYT did not have a weekly close below its QP in 2013 as it was up over 41% for the year.
- What happened at the end of the 2nd quarter of 2013 is a quite normal occurrence when using the quarterly pivot analysis.
- On the last Friday of the 2nd quarter, IYT closed at $108.97, which was well above the QP.
- The next week (point 1), it opened the week at $109.63 but then traded to a low of $108.71 before closing the week at $110.98, which was well above the QP at $109.41.
- This signal stayed in effect until the second week of April 2014 (point 2) when IYT closed below its QP.
- The 20-week EMA was tested the following week before IYT closed back above the QP.
- With the downside reversal on the week ending October 10, IYT closed at $140.90, which was well below the QP at $149.70.
- The weekly OBV did confirm the recent highs (line a) but it did break its uptrend, line b, during the recent decline.
The Sector Select SPDR Energy (XLE) has been one of the main casualties during the recent correction as it dropped from a late June high of $101 to a low last week of $77.51. This was a decline of 23.2% from high to low.
- At the start of the 3rd quarter of 2013, XLE maintained its prior buy signal from April 26, 2013 by closing the first week of the quarter above its QP.
- In the 4th quarter of 2013, it traded below its QP during the first week of the new quarter but closed the week above it, point 5.
- The week of January 17, 2014, XLE closed the week at $84.76, which was barely above the QP at $84.74.
- The following week, XLE did close well below the QP, point 6.
- Four weeks later, XLE had closed back above its QP as XLE then accelerated to the upside.
- Five weeks after the June high, XLE closed at $95.26, which was below the QP at $95.98 (point 8).
- This signal was released the following week (point 9) but it only lasted four weeks.
- The week ending September 12, XLE traded sharply lower to close at $93.08, which was well below the QP.
- So far, in the 4th quarter of 2014, XLE has stayed well below its QP of $93.88.
- The weekly OBV completed its top formation at the end of September (see
arrow) and has since plunged.
What it Means: I hope these examples will add to your understanding of pivot point analysis as I discussed in The Most Important Pivot Level. I closely monitor both the monthly and quarterly pivot levels on ETFs as well as stocks thanks to John Person's software.
The positive signal last week for the iShares Nasdaq Biotechnology (IBB) should now be watched closely as it was showing some positive signs during the middle of last week.
How to Profit: No new recommendation.


