As the market decline has accelerated, many are panicking and some are concerned over a new bear market, so MoneyShow’s Tom Aspray studies the charts to determine what needs to happen next to stabilize the market.
The Dow Industrials plunge below the 16,000 level early Wednesday afternoon was consistent with panic or margin liquidation. The decision by AbbVie, Inc. (ABBV) to not recommend the $52 billion acquisition of Dublin-based Shire (LSS:SHP) did not help as many hedge funds were heavily long Shire, which dropped 30% on Wednesday.
According to many money managers, their clients are panicking as the decline has accelerated with many concerned over a new bear market. But it is somewhat puzzling that the latest survey results from the American Association of Individual Invests (AAII) shows that the bullish % increased this week to 42.66% from 39.88% the previous week. The number of bears rose slightly from 30.98% to 33.70% this week.
The futures are showing sharp loses in early trading with the Dax Index down 1.61% while Spain and Italy are down over 3%. Of course, crude oil prices have led the market lower with the December crude oil contract dropping below $80 per barrel.
So what can traders and investors expect next?
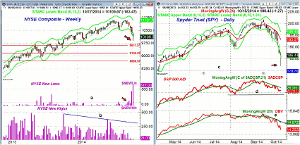
Chart Analysis: The weekly chart of the NYSE Composite shows the intraday drop to a low of 9886 before it rebounded to close at 10,109.
- The drop took the NYSE well below the weekly starc- band at 10,144.
- Of course, the daily starc- band has been violated several times so far this month.
- The major 38.2% Fibonacci support from the June 2012 low is at 9611, which is 2.8% below Wednesday’s low.
- The number of stocks making new lows on the NYSE jumped sharply Wednesday, reaching 617.
- The number of new weekly lows broke out of its trading range, line a, four weeks ago.
- The number of new highs has formed lower highs since 2013, line b.
- During the last sharp selloff in August and September 2011, the new lows peaked at 825 early in the decline.
- Just before the market bottomed in October only 787 stocks hit new lows.
- There is initial resistance at 10,250 with monthly projected pivot support at 10,450.
The daily chart of the Spyder Trust (SPY) shows the intraday plunge to a low of $181.72.
- The support from the February 2014 low is at $179.70, line c.
- The S&P 500 A/D line did not drop that strongly Wednesday as the A/D ratios were not as weak as prices.
- The A/D line has, so far, held above the support, line d, from the August lows.
- The daily on-balance volume (OBV) looks much weaker as it has plunged sharply this week.
- The OBV is well below its declining WMA.
- There is next resistance in the $187.50-$188 area with further at $189-$190.
- The declining 20-day EMA is at $193.07.
NEXT PAGE: 2 More ETFs to Watch
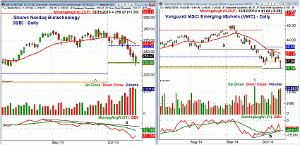
|pagebreak|The iShares Nasdaq Biotechnology Index (IBB) closed higher on Wednesday after testing the quarterly projected pivot support at $222.93.
- IBB did close the day higher, with the quarterly pivot at $265.34.
- The declining 20-day EMA is a bit higher at $266.98.
- A daily close above the early October high of $277.43 should confirm that the correction is over.
- The daily relative performance is still above its WMA.
- The volume has been especially heavy over the past three months as it has been double the three month average.
- The daily OBV turned up Wednesday but is well below its declining WMA.
- The downtrend, line a, in the OBV is even higher.
- The weekly OBV (not shown) dropped below its WMA three weeks ago.
The Vanguard MSCI Emerging Markets (VWO) dropped down to test its quarterly projected pivot support at $40.09 before closing at $41.04.
- There is additional support at $39.38 with the February low at $35.82.
- There is next resistance at $41.80 with the declining 20-day EMA at $42.13.
- The quarterly pivot at $43.05 now represents more important resistance.
- The daily and weekly RS lines (not shown) are both rising, with the daily above its WMA.
- The daily OBV has turned down but is still above its WMA.
- The short-term uptrend in the OBV, line b, is also still intact.
- The weekly OBV (not shown) has dropped well below its WMA, which is now turning lower.
What it Means: There are no signs yet that the selling is over though the reversal Wednesday is a slightly positive. The recent action in the iShares Nasdaq Biotechnology Index (IBB) and the Vanguard MSCI Emerging Markets (VWO) is encouraging, especially if it continues. A sharply higher close is needed to stabilize the market.
The best case scenario is that a short-term bottom will lead to a trading range that could easily last into November before the correction is really over.
A V-shaped bottom is now looking less likely but I continue to expect the market to be higher by yearend. As I discussed last Friday, there are no signs that a bull market top is in place or that we are on the verge of a new recession.
How to Profit: No new recommendation.


