The better-than-expected US Non-Farm Payroll data fueled yet another stock market rally Friday, and MoneyShow’s Tom Aspray looks at ten of the most oversold Dow stocks to determine if any look attractive at current levels.
Stocks ended the week on a positive note as many of the daily technical studies are now rising. In Friday’s Week Ahead column, I pointed out the bullish divergence in the McClellan oscillator that formed last Thursday. This divergence could be confirmed with another day of positive A/D numbers Monday.
The Asian markets recorded nice gains on Monday and the EuroZone markets are also showing nice gains. The S&P futures are also higher and a daily close back above the 1980 level will make the market bears nervous.
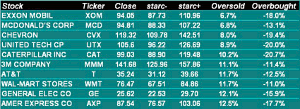
The relative performance analysis on the SPDR Diamond Trust (DIA) indicated it was becoming a market leader in the middle of September. The weekly RS line closed last Friday above the downtrend that goes back to June 2013. My regular monthly starc band scan—as of Tuesday September 30—revealed several that are moderately oversold.
Those stocks that are closest to the lower or starc- band are considered to be better risk buys than if they are trading near the upper or starc+ bands. But before you buy, you also need to look at the volume and relative performance analysis, and then assess the risk.
At the top of the most oversold list is Exxon Mobil Corp. (XOM), which closed the month just 6.7% above its monthly starc- band at $87.73. Of course, XOM has been hit hard by plunging crude oil prices. XOM—like many of the most oversold Dow stocks—has declined even further in the first few days of October.
Many other well known Dow stocks are also on the top ten list and many do offer attractive yields. A close examination of the monthly and daily charts of these ten stocks can help one determine if they have declined enough to buy.
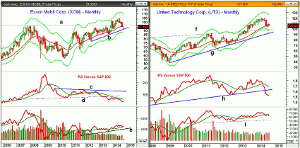
Chart Analysis: The monthly chart of Exxon Mobil Corp. (XOM) shows that the uptrend, line b, was tested in September. XOM is down 5.91% YTD.
- The decline has taken prices back below the 2007-2008 highs at $96.40.
- Often times a retest of the breakout zone provides a good buying opportunity but the technical studies must support this conclusion.
- The quarterly projected pivot support is now at $90.43.
- The monthly relative performance dropped below major support in 2013.
- The RS line has continued to decline as the rallies have failed at the declining WMA.
- The weekly RS analysis (not shown) is also making new lows with no signs of a bottom.
- The monthly OBV is now testing its rising WMA and is well above the support at line e.
- There are no signs yet of a bottom in the weekly OBV.
- There is initial resistance now at $95.40-$96 with the quarterly pivot at $97.24.
United Technology Corp. (UTX) traded in a tight range last month for the second month in a row. UTX is down 6.69% YTD. It closed last week at $104.42 and is now closer to its monthly starc- band.
- There is monthly support now at $102.56 with the monthly projected pivot support at $100.87.
- The breakout level from the 2007 and 2011 highs is at $98.60, line f.
- The longer term uptrend, line g, is now at $92.85.
- The monthly relative performance broke major support, line h, in July.
- The RS line is now well below its declining WMA.
- The monthly on-balance volume (OBV) tested its flat WMA in August and turned down last month.
- The weekly OBV (not shown) is also below its WMA as volume was heavy last week.
- There is first resistance at $106.20 with the quarterly pivot at $107.99.
Next Page: Two More Stocks to Watch
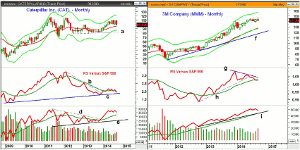
|pagebreak|Caterpillar Inc. (CAT) has plunged over the past five weeks as sharply lower grain prices have hurt the stock. It is down 11.69% in the past three months but is still up 9.34% YTD.
- Over the past six months, CAT has traded in a $13 dollar range.
- The 20-month EMA is at $96.13 with the quarterly projected pivot support at $94.43.
- The monthly relative performance broke its downtrend, line b, at the end of 2013.
- The RS line has dropped back below its WMA but is still above long-term support at line c.
- The monthly OBV also broke out at the end of 2013, as resistance (line d) was overcome.
- The OBV is holding firm and is well above support at line e.
- The weekly OBV is also below its WMA and still declining WMA.
- There is initial resistance now at $100-$101.40 with the quarterly pivot at $102.86.
3M Company (MMM) formed a doji last month for the second time in the past four months. It is just up 1.77% YTD but down 3.02% in the past three months.
- The six month lows are in the $136.99-$137.61 area with the quarterly pivot support at $136.90.
- The monthly relative performance formed lower highs, line g.
- The uptrend in the RS (line g) was broken in June and it is just below its WMA.
- The monthly OBV is still clearly positive as it is well above its rising WMA and support at line h.
- The weekly OBV (not shown) is also still above its rising WMA.
- The daily chart reveals that MMM triggered a high close doji buy signal on Friday.
- The quarterly pivot is at $142.39 with further chart resistance in the $143.40 area.
What it Means: Though the SPDR Diamond Trust (DIA) is emerging as a new market leader, deterioration in the technical studies in Exxon Mobil Corp. (XOM), United Technology Corp. (UTX), and 3M Company (MMM).
3M Company (MMM) looks the best of the four but the daily studies are still negative. Therefore, without a confirmed bottom for the overall market, would stay on the sidelines for now.
How to Profit: No new recommendation.


