Small-caps
should be doing better (not worse) than large-caps if the economy is
growing
and the oft-overlooked mid-caps should also benefit, so
MoneyShow’s Tom
Aspray examines the weekly charts of
the ETFs
that track them to determine key levels to watch in the weeks ahead.
The
relatively
weak market internals on Wednesday’s rally
suggested that it might not be sustainable and the weak action in the
euro
markets sealed the deal by Thursday’s
It should be no
surprise that the market is getting oversold with
the Nasdaq 100 down almost 2% along with the Biotech sector. Asian stocks were mostly
lower as well but in
early trading the EuroZone markets and S&P futures are trying
to stabilize.
The McClellan
oscillator has dropped to -310, which is below the early
August low of
-278. The Osc shows a pattern of lower lows and it would likely take a
week or
more before any bullish divergences could be formed. The sharp rise in
the VIX
is also a negative and it will take a powerful rally to reverse it back
to the
downside.
One difficult
question—or conundrum—for many analysts is the much
weaker action of the small-cap stocks. Their view is that the economy
is
continuing to strengthen and, if so, the small-caps stocks should be
doing
better not worse than the large-cap stocks.
Though the Russell
2000 is the most widely followed small-cap
index, an interesting
research report from IFA.com reveals that, up through the end
of 2013, the
small-cap S&P 600 has had an annualized return of 11.05%.
During the same
time period, the Russell 2000 is up just 9.27%.
This is attributed
to the fact that the Russell 2000 contains many
more illiquid stocks and its components are adjusted in the middle of
each
year. In contrast, the S&P 600 components are changed by the
decision of a
committee.
Not much attention
has been paid to the mid-cap stocks that should
also benefit from a stronger economy. A look at the weekly charts of
the ETFs
that track both the S&P 400 and S&P 600 reveals the key
levels that
should be monitored in the weeks ahead.
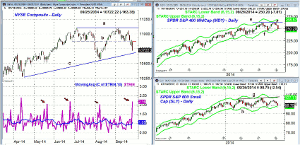
Chart Analysis: The NYSE
Composite rallied back to near term resistance, line b, on Wednesday
before
reversing back to the downside.
- Thursday’s close was just above
the monthly projected pivot support at 10,717.
- The weekly uptrend is now at
around 10,680 with the August low at 10,557.
- The quarterly projected pivot
support for the 4th quarter is calculated now at
10,483.
- The ARMS
Index, or TRIN, closed Thursday at 2.16.
- It is more oversold now than it
was at the August low when it reached 2.01.
- It reached 2.18 in June and then
2.37 at the April lows.
- On February 3, it closed at
3.42, which was an extreme oversold reading.
- The NYSE needs a strong close back above 10,900 to stabilize the daily chart.
The SPDR
S&P 400 MidCap
(MDY) has dropped just over 3% in
the past three months but is still up 3.26%
YTD.
- The chart shows that a weekly
low close doji sell signal was triggered three weeks ago (see arrow).
- The weekly trendline support,
line f, is now being tested.
- The weekly starc- band is now
at $247.34 and the August
low was $246.06.
- For October, the quarterly
projected pivot support is at $243.03.
- For October, the monthly pivot
is projected to be at $253.23.
- The weekly OBV (not shown) did
confirm the early September highs but will close below its WMA this
week.
- There is strong weekly
resistance at $263.39 with the weekly starc+ band at $268.87.
The SPDR
S&P 600 Small
Cap (SLY) is down 5.38% in the past
three months and is down 3.05% YTD. So
far in 2014, the results are comparable with the iShares
Russell 2000 (IWM).
- The weekly chart shows that SLY
could close below the weekly support, line h, this week.
- SLY has dropped below the August
low at $98.35 this week.
- This makes the May low at $96.23
even a more important level of support.
- The weekly starc- band is at
$97.03 with October’s projected pivot support at $94.14.
- The monthly pivot for October is
at $100.35 and a daily close back above this level would be a plus.
- The major resistance, line g,
and the starc+ band are now at $107.11.
What it Means: If the
current decline drops both the SPDR
S&P 400 MidCap (MDY) and SPDR
S&P 600 Small Cap (SLY) decisively below the May lows
it would be a
concern for the overall market.
How to Profit: No new
recommendation.
For more on the
markets, you might enjoy some of Tom’s recent
articles:
Monthly
OBV
Analysis of Four Key Markets


