The dollar's strength has put additional pressure on the owners of gold and the gold miners, so MoneyShow's Tom Aspray shares three facts that current owners of these instruments should know.
The stock market's sharp rally on Wednesday caught the markets by surprise as did the much better than expected data on New Home Sales. The data did not help most of the homebuilders as the iShares Dow Jones Home Construction ETF (ITB) were lower on the day. The technical outlook for the industry group remains negative.
The rally also confused the financial media, which has been focusing on the "Alibaba top" since the start of the week. In yesterday's technical review of the market, I pointed out that the daily technical studies were negative but made the case that the current correction should turn out to be a buying opportunity.
On Wednesday's rally, the market internals were acting weaker than prices with the McClellan oscillator only rising from -224 to -166. Much stronger market internals are needed to signal a more sustainable market rally otherwise another wave of selling is likely.
Once again, those who were long gold or the gold mining stocks were left behind on the market rally as it has been a rough month for the precious metals as the SPDR Gold Trust (SPY) is down almost 5%. This is consistent with the Monthly OBV Analysis of Four Key Markets published at the start of the month which favored another push to the downside.
Those that are still long the metal or miners need to be aware of three important facts. A reading of the financial press over the past few weeks has revealed decidedly negative outlook for the metals. The high degree of bearish sentiment was further confirmed in an article by Mark Hulbert as his gold sentiment indicator has only recorded such a high level of bearishness once in the past thirty years.
A look at the charts of gold and the gold miners will reveal two more important facts that gold owners should know.
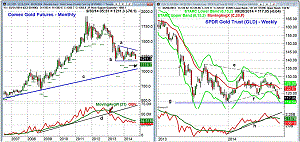
Chart Analysis: The monthly chart of the Comex Gold futures shows that it is very close to making new lows for the year.
- The monthly flag formation (lines a and b) has negative implications.
- Based on current data, the monthly projected pivot support for October is at $1114.
- The downside targets from the flag formation range from $1020 to $980.
- The major uptrend, line c, is in the 1050 area.
- The monthly OBV broke its major support, line d, in early 2013 and has been below its WMA since November 2012.
- The OBV shows a pattern of slightly lower lows but a break below $1181 should trigger heavier selling.
The weekly chart of SPDR Gold Trust (GLD) shows that the chart support, line f, was broken four weeks ago.
- GLD has tested its weekly starc- band twice in the past three weeks.
- The weekly band is now at $114.64 with the long-term chart support, line g, at $114.50.
- The monthly projected pivot support for October is at $112.68. .
- As is often the case, the weekly on-balance volume (OBV) broke its support (line h) three weeks before prices broke support.
- The OBV is now well below its WMA, which is starting to roll over.
- The former uptrend (line f) is at $122 with the declining 20-week EMA now
at $122.87.
NEXT PAGE: 2 More Gold Miners ETFs to Watch
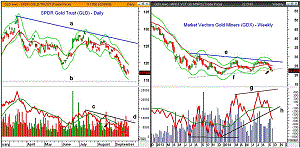
|pagebreak| The downtrend in the SPDR Gold Trust (GLD) is even more clear on the daily chart as it has been hugging is daily starc- band for most of the past three weeks.- The starc band is now at $115.40 with the major support at $114.50, line b.
- The daily OBV broke its support, line d, on August 20 as GLD gapped below support.
- The daily OBV has been acting weaker than prices as it has dropped below the late 2013 lows.
- The OBV has initial resistance at its declining WMA with further at the downtrend, line c.
- There is initial daily chart resistance in the $118.50 area.
- The declining 20-day EMA is at $119.58 as is the starc+ band.
The negative outlook on the Market Vectors Gold Miners (GDX)
was discussed in detail on August 26.
- The close last week was just below the weekly support, line f.
- The weekly starc- band at $22.28 has been tested this week.
- The weekly flag formation, lines e and f, has initial downside targets in the $18.50 area.
- October's monthly projected pivot support is at $18.25 with additional chart targets in the $14-$16 area.
- The weekly OBV did form higher highs in July (line g) before reversing to the downside.
- The weekly uptrend, line h, was broken two weeks ago.
- The OBV is still slightly above the May lows.
- The daily OBV (not shown) formed a negative divergence at the August 12 high.
- The divergence was confirmed by the end of the month.
- GDX is well below its 20-day EMA at $23.98 with the 20-week EMA at $24.92.
What it Means: Here is what the owners of either gold or the gold miners should know:
- The high level of bearish sentiment does make a rebound likely in the next several weeks.
- Owners should realize that the next downside targets are 2-5% below current levels and these levels could be tested before we get a rebound.
- Those who want to sell their longs should monitor the 20-day EMA as a resistance level for selling.
Finally, if you are still long the metals, have a plan is place, especially if you are holding for the long-term. It is clearly possible that the metals will look better in 2015 but the risk on the long side, for now, is currently high.
How to Profit: No new recommendation.


