With two consecutive days of solid declines, many investors are wondering just how much lower stocks will go, so MoneyShow’s Tom Aspray looks at the major market indices and their technical readings to see if the current decline is still a buying opportunity.
Another day of weakness has many wondering how much lower stocks will go. With two consecutive days of solid declines, the financial press is adding to the investor’s wall of worry.
I thought last week that the mania over Alibaba’s IPO would cause more cautious comments for the overall market and now some are once again digging into Fed Chair Janet Yellen comments for hidden warning that rates may be raised sooner than expected.
The death cross in the Russell 2000 (the 50-day MA dropping below the 200-) is also getting quite a bit of attention as the small-caps bore the brunt of the selling on Tuesday. Though, technically, the small-caps do look weak, I do not view the death cross to be that great an indicator.
I tend to agree with veteran market analyst Art Cashin who commented that “Doing this for 50 years tells me the death cross is more important to the media than to the markets. With this week’s action some measures of the market are getting back to oversold levels last seen at the August lows.”
The % of Nasdaq 100 stocks above their 50-day MA has dropped below 30% not far above the 25% level reached on August 5. Looking at all US stocks, the current reading shows that 48% are still above their 50-day MAs and, in early August, just 33% were above their 50-day MAs.
A look at the major market indices and their technical readings will help you decide whether the current decline is still the September buying opportunity I discussed last month.
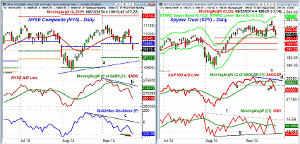
Chart Analysis: The NYSE Composite dropped convincingly below the recent swing low on Tuesday as the monthly pivot at 10,886 was violated.
- The quarterly pivot is now at 10,758 with the monthly projected pivot support now at 10,717.
- In early August, the NYSE had a low of 10,550 with the May low at 10,432.
- The NYSE Advance/Decline Line made a convincing new all time high on August 29.
- On the September 5 closing, the A/D line formed a slightly lower high, line b.
- The A/D line then dropped below its WMA and shows a clear pattern of lower lows and lower highs.
- It is well below its WMA so it would take some time before it was able to reverse back to positive.
- The McClellan oscillator has dropped to -224 and new correction lows.
- In early August, it hit a low of -278 so it has reached a level where a reversal is likely.
- There is near term resistance at 10,888 with the 20-day EMA at 10,948.
The Spyder Trust (SPY) is still holding above the September 15 low of $197.46. This is just above the minor 38.2% Fibonacci retracement support at $197.15.
- The monthly pivot stands at $196.44 with the 50% support at $195.69.
- The 61.8% support is at $194.23 with the monthly projected pivot support at $193.
- The S&P 500 A/D line did not confirm the highs last week, line d.
- This divergence has been confirmed by the drop below support at line e.
- The daily on-balance volume (OBV) broke out above resistance, at line f, last week but then reversed to the downside.
- It is now testing the support from the August lows.
- The weekly OBV (not shown) did confirm the recent highs and is well above its WMA.
- There is initial resistance now at $199-$199.40 and a close back above $200.40 would be positive.
NEXT PAGE: 2 More ETFs to Watch
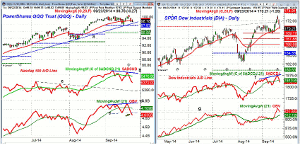
|pagebreak|The PowerShares QQQ Trust (QQQ) is down 1.7% from its 52-week high of $100.56.
- The September low of $97.82 is just above the monthly pivot of $97.63.
- This also corresponds to the July highs with the monthly projected pivot support at $95.56.
- The major support is now at $93.70, which was the August low.
- The Nasdaq 100 A/D line peaked in early September and then formed a divergence at last week’s high, line b.
- The A/D line has dropped below the recent lows confirming a new daily downtrend.
- The daily OBV did confirm last week’s highs, line d.
- The OBV just violated the recent lows, line e, on Tuesday.
- The weekly OBV (not shown) is well above its WMA and did confirm the recent highs.
- The 20-day EMA is now at $99.03 with further resistance at $99.75.
The SPDR Dow Industrials (DIA) staged an impressive new high last week at $173.32 as the daily starc+ band was tested. It is now at $173.71.
- The quarterly pivot resistance is at $174.91 with the weekly at $176.03.
- The Dow Industrials A/D line made convincing new highs last week, line f.
- The A/D line has dropped below its WMA but is still well above the September lows.
- The daily OBV also broke out above its key resistance at line g.
- Based on last week’s high, the 38.2% Fibonacci retracement resistance is at $169.17.
- The 50% retracement support stands at $167.88.
- The quarterly pivot is at $164.58 but tentatively will rise to $168.66 in October.
What it Means: The futures are a bit higher in early trading but the technical readings on the broadest market measures, the NYSE Composite, and Spyder Trust (SPY) show no signs yet of bottoming. The confirmed daily divergences could result in a more serious decline but I continue to expect the current decline to provide a good buying opportunity for a rally into the end of the year.
Some of the stocks and ETFs that broke out to the upside in September, like the financials, have just pulled back to the breakout levels. So the strength of the rally from these support levels will be important.
Other weak sectors, like the homebuilding stocks, continue to lag the overall market and are likely to remain under pressure. The New Home sales data today will be watched closely.
How to Profit: Should be long the PowerShares QQQ Trust (QQQ) $86.88 and would add a 25% long position in at $97.52 or better, stop at $92.89.


