Healthcare has been a top performing sector for the past few years, gaining more in Tuesday's session so MoneyShow’s Tom Aspray takes a technical look at two healthcare ETFs and a stock to determine whether the correction is over or not.
The stock market turned on a dime in the morning session as the S&P futures rallied over 20 points in just five hours. The market internals were neutral in early trading but closed better than 2-1 positive. The McClellan oscillator rose to -121 after reaching a low of -191 on Monday.
The semiconductor and utility stocks led the way but the main question is whether the correction is now over. It has been my view since late August’s A September Buying Opportunity? that we would get buyable pullback this month.
The recent decline has taken many of the averages back to initial Fibonacci retracement support and their monthly pivot levels. The market needs to now prove itself on the upside by adding to Tuesday’s gains with even stronger A/D ratios.
Of course, the market is waiting for this afternoon’s FOMC announcement but if we do not get continuation on the upside by the end of the week, a further correction is clearly possible.
Healthcare has been one of the top performing sectors for the past few years but many are wondering how long this will continue. The somewhat narrowly focused Select Sector SPDR Health Care (XLV) was up 17.4% in 2012, 41.4% in 2013, and 17.2% YTD, but how long can this rally continue?
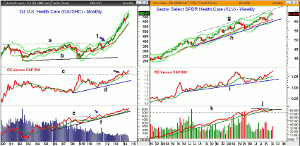
Chart Analysis: The DJ US Health Care (DJUSHC) broke out above 12-year resistance in March 2012 (point 1), which was a very bullish development.
- DJUSHC has been in a powerful uptrend ever since with the monthly starc+ band now at 698.
- The rising 20-month EMA and first major monthly support is in the 580 area.
- The monthly relative performance broke out above the early 2009 highs, line c, at the start of the year.
- The RS line has continued to make new highs with prices.
- The weekly on-balance volume (OBV) led prices higher as it overcame resistance at line e, a year ahead of the price breakout (see arrow).
- The OBV has been holding above both its uptrend and the support at line f.
- The weekly OBV (not shown) did make a new high in early September.
As I noted in a previous trading lesson, the top ten holdings of Select Sector SPDR Health Care (XLV) make up over 54% of the ETF with Johnson & Johnson (JNJ) making up over 12%.
- The weekly chart shows that dojis have formed over the past two weeks.
- The weekly starc+ band is at $65.60 with trendline resistance at $66.50, line g.
- The monthly pivot is at $62.49 with the projected pivot support at $61.07.
- The rising 20-week EMA, now at $61.20, was tested in early August.
- The weekly relative performance moved back above its WMA in June.
- The RS line has recently exceeded the February highs.
- The weekly OBV peaked in early July and has recently formed a lower high, line j.
- The OBV has key support at line k, and a break below this level would confirm the negative divergence.
- The monthly and daily OBV (not shown) did confirm the recent highs.
NEXT PAGE: Another ETF and Another Stock to Watch
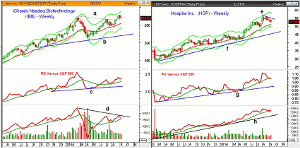
|pagebreak|The iShares Nasdaq Biotechnology (IBB) broke through weekly resistance, line a, four weeks ago and made a new high at $278.78. It is now 1.8% below this high.
- On a move above this high, the weekly starc+ band is at $289.20.
- IBB is up 19.46% YTD and over 9% in the past three months.
- The monthly pivot at $266.87 is now being tested with the projected monthly support at $257.03.
- The rising 20-week EMA is just a bit lower at $256.59.
- The weekly RS line bounced off its WMA in August and is in a clear uptrend.
- The relative performance has not moved above the highs from early in the year.
- The weekly OBV has also formed lower highs, line c, but is above its rising WMA.
- The daily OBV (not shown) did form a negative divergence at the highs and then dropped below its WMA.
- There is short-term resistance now at $275.
Hospira, Inc. (HSP) is a $9.0 billion dollar provider of injectable drugs that has been correcting for the past five weeks and is back to the June highs.
- It peaked at $55.78 and is now 6.2% below its high.
- The monthly projected pivot support at $52.57 is being tested as it triggered a HCD buy signal Tuesday.
- The 20-week EMA is at $51.18 with the starc- band at $49.80.
- There is initial resistance now at $54.33 and the monthly pivot.
- The weekly relative performance did confirm the recent highs and has now dropped back to its WMA.
- The RS line has long-term support at line g.
- The weekly OBV also made a new high with prices and is holding above its WMA.
- The daily OBV (not shown) has turned up but is still below its WMA.
What it Means: The long-term demographics do favor the healthcare sector but the weekly analysis of the Select Sector SPDR Health Care (XLV) will need to be watched. If the weekly divergence in the OBV is confirmed then XLV could see a deeper pullback.
The combined weekly and daily analysis of the iShares Nasdaq Biotechnology (IBB) does make a further pullback likely.
Hospira, Inc. (HSP) appears to have bottomed but would use a fairly tight stop in case the correction is not over yet.
How to Profit: For Hospira, Inc. (HSP) go 50% long at $53.05 and 50% at $52.54 with a stop at $51.13 (risk of approx. 3.1%).
On September 23, I will be giving a Webinar on FX trading techniques. If you would like to join me sign up here.


