There is often an inverse relationship between the two, so the stronger dollar has not helped the precious metals as of late, and MoneyShow’s Tom Aspray studies the charts to see if now is the time to buy the gold miners or add to long positions.
As mutual fund and other stock holders cheered the intra-day move above the 2000 level in the S&P 500 not all stock holders were happy. The weak data on New Home Sales hit the homebuilders and the Semiconductor Holders ETF (SMH) declined 0.37%, triggering a daily low close doji sell signal.
The dollar has continued to move higher overnight with the euro making fresh new lows. This has been another positive for the Euro zone markets as the German Dax has reached the 50% retracement resistance from the June highs. The weaker euro should help their sagging exports.
The bottoming signals from August 7 (Get Ready for a Rally) have produced a much stronger rally than I expected at the time. Though the daily and weekly trends are positive, I would not chase the long side as the bullish sentiment is too high.
The stronger dollar has not helped the precious metals as there is often an inverse relationship between the two. The Philadelphia Gold/Silver Index lost 1.38% on the day though an Oppenheimer analyst predicted a 40% upside for the gold miners just two weeks ago.
Does this mean you should be buying the miners at current levels or adding to your position if you are already long?
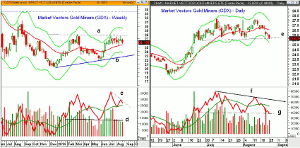
Chart Analysis: The Market Vectors Gold Miners (GDX) has 39 holdings with an expense ratio of 0.53%.
- On the weekly chart, a flag formation, lines a and b, has been forming since late 2013.
- For the past six weeks, GDX has traded between $27.78 and $25.59.
- GDX closed on the lows Monday, which was just above the August 5 low and the 20-week EMA.
- The failure of GDX to rally in impulsive fashion suggests that the trading in 2014 is just a pause in the downtrend or a continuation pattern.
- The quarterly pivot is at $24.97 with the weekly starc- band at $23.76.
- Though prices have been moving sideways, the OBV has formed sharply lower highs, line c.
- A drop in the on-balance volume (OBV) below its WMA and the recent lows would be negative.
- The OBV has next major support at line d.
The daily chart shows that the key chart support, line e, is now being tested.
- GDX is still up 21.25% YTD but down 4.47% in the last month.
- The daily starc- band is at $25.24 with the minor 50% Fibonacci retracement support at $24.80.
- The daily OBV has formed lower highs, line f, since the early July highs.
- The OBV is now very close to breaking the support, at line g, and it needs a high volume rally to turn it around.
- There is minor resistance now at $26.50 and the 20-day EMA.
- There is further resistance at $27 and a close back above this level would improve the outlook.
- Based on current data, the monthly pivot for September will be at $26.38.
NEXT PAGE: Two More Gold Miners to Watch
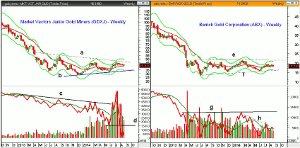
|pagebreak|The Market Vectors Junior Gold Miners (GDXJ) has an expense ratio of 0.57% with 61 stocks in the portfolio.
- GDXJ is up 29.63% YTD but has lost 6.16% in the past month.
- The early July high of $46.50 tested the weekly starc+ band and the weekly resistance at line a.
- The monthly pivot at $42.84 has been tested several times in August but GDXJ has failed to close above it.
- The 20-week EMA is now being tested with next key support at $39.40 and the quarterly pivot.
- The weekly starc- band is at $35.63 with the weekly uptrend, line b, in the $33.65 area.
- A completion of the flag formation has initial downside targets in the $28 area.
- The weekly OBV broke through resistance, line c, in June and surged to the upside in July.
- The OBV has since reversed sharply as the late May lows, line d, have been broken.
- The weekly OBV is now acting weaker than prices.
- The daily OBV (not shown) is below its WMA but is still above the July lows.
Barrick Gold Corporation (ABX) is a $21 billion producer of gold and copper and has a current yield of 1.7%. It is trading 16.04% below its 52-week high as it is up just 2.72% YTD.
- The sideways pattern, lines e and f, goes back to May 2013 when the high was $21.64.
- In February, ABX had a high of $21.45 but on Monday it dropped below its 20-week EMA.
- The early August low is at $17.75 with the quarterly pivot at $17.64.
- Using the width of the trading range, a weekly close below $15.47 will project a decline to the $9-$11 area.
- The weekly OBV also failed to move above the 2013 highs early this year, line g.
- The OBV has since formed lower highs, line h, and could drop below its WMA this week.
- Volume has increased over the past two days but the daily OBV (not shown) is acting better.
- It is still above the important support from the July lows.
- There is initial resistance at $18.56 and the 20-day EMA.
- More important resistance in the $19-$19.36 area with the quarterly projected pivot resistance at $19.82.
What it Means: The technical picture for the gold mining ETFs and Barrick Gold Corporation (ABX) has deteriorated even though this is typically a strong seasonal time period. The close this week will tell us more but the apparent weekly continuation patterns do make me nervous.
It is possible that we will just see a test of the June lows, which could set up another trading opportunity. Traders who are long should consider using tight stops or looking for a bounce to reduce your position.
I see no technical reason to buy the miners now and would not add to long positions.
How to Profit: No new recommendation.


