Filings by Soros revealed that it sold the entire holdings in three tech companies following yesterday’s SEC 13F filing deadline, so MoneyShow’s Tom Aspray takes a technical look at the charts to determine if this is a sign of trouble in the tech sector or just three technically weak stocks.
The market was led higher Thursday by the home building stocks and the transports. The Dow Jones Transportation Average was up 0.66% while the iShares US Home Construction (ITB) gained 1.68%. The market internals on the NYSE were 2-to-1 positive.
The daily technical outlook has improved this week and Friday’s close will be important. Futures are higher in early trading as are the markets in Europe. Though the German Dax is trading well above its recent lows, there are not strong signs that this market has bottomed. The sharp increase in bullishness by individual investors does favor a pullback.
With yesterday’s SEC 13F filing deadline, the changes in hedge fund positions are closely scrutinized. For example, filings by Soros Fund Management, LLC revealed that it sold the entire holdings in three technology companies.
Is this a sign of trouble in the technology sector or were these just three technically weak stocks?
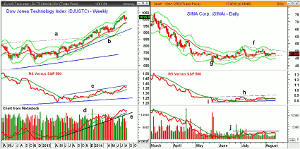
Chart Analysis: The pullback in the Dow Jones Technology Index (DJUSTC) over the prior two weeks took the index 3.5% from its highs.
- The pullback has held well above the strongly rising 20-week EMA at 975.
- At last week’s lows, the daily starc- bands were tested with the weekly now at 965.
- The weekly technical studies—like the relative performance—are still positive.
- The RS line shows a series of higher highs and is well above its rising WMA.
- The weekly OBV broke out to new highs in the middle of June as resistance at line d, was overcome.
- The OBV confirmed the recent highs and is holding well above its uptrend.
- There is next resistance at 1025 with the weekly starc+ band at 1053.
Sina Corp (SINA) is a Chinese online media company that is down 43.5% YTD after gaining over 67% in 2013.
- The daily chart shows a short-term flag formation, lines f and g.
- This is consistent with a continuation pattern or a pause in the downtrend.
- A break of support at $44.86, line g, will signal a resumption of the decline.
- There is next support at $42.40 with the weekly starc- band at $37.85.
- The relative performance has been flat since late May, line h.
- The RS line support, at line i, should be watched closely for signs of a break to the downside.
- The daily on-balance volume (OBV) has failed to move above the resistance at line j.
- The OBV has just dropped below its WMA with important support at the July lows.
- There is initial resistance now at $49-$51 with the monthly projected pivot resistance at $56.58.
NEXT PAGE: Two More Techs to Watch
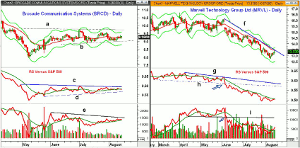
|pagebreak|The hedge fund also sold its entire positions in Brocade Communications (BRCD), which is a data storage company. It is now 15.5% below its 52-week highs and is up 4.85% YTD.
- BRCD peaked in April and then dropped to a low of $7.92 in early May.
- The rebound from the lows hit a high of $9.75, which was just below the 61.8% Fibonacci retracement resistance at $9.77.
- BRCD is now testing the quarterly pivot at $9.35 with the daily starc+ band at $9.57.
- A drop below $8.89 will suggest that the rebound from the May lows is over.
- The weekly starc- band is at $8.22.
- The relative performance also shows a trading range, lines c and d.
- The RS line is just barely below its WMA and a drop below support could precede a price break.
- The daily OBV has been in a narrow range recently as it has stayed below the resistance at line e.
- The weekly OBV (not shown) is still above its WMA.
Marvel Technologies Group, Ltd. (MRVL) is a $6.77 billion dollar semiconductor company. The stock is down 12.48% for the past three months and 6.47 YTD.
- The daily chart shows that the steep downtrend, line f, is now being tested.
- There is next resistance at $13.80 with the 38.2% retracement resistance at $14.19.
- The quarterly pivot is at $15.01 with the 61.8% Fibonacci resistance at $15.10.
- The relative performance dropped below support, at line h, in early June as it was leading prices.
- The RS line has formed slightly lower lows and is well below resistance at line g.
- The daily OBV also broke support (line i) when MRVL was trading at $15.22.
- The daily OBV has since formed lower lows but moved above its WMA this week.
- The weekly OBV (not shown) is still below its declining WMA.
- Weekly support now at $12.73 with the weekly starc- band at $12.03.
What it Means: Investors and traders should keep an eye on the 13F SEC filings as they are a good source for stocks to put on your watch lists. Of course, the sales can alert you to possible problems if you happen to own the stock.
The new stocks they are buying often get a short-term boost after the filings are released but most eventually pullback to the pre-filing levels. This can create good buying opportunities if the technical indicators are strong and the risk can be controlled.
These three tech stocks do look weak though several have already seen sharp declines. The weekly analysis of the Dow Jones Technology Index (DJUSTC) still looks positive.


