The current reversal in investor sentiment is consistent with a rebound in a downtrend and not the resumption of the major uptrend, so MoneyShow's Tom Aspray turns to the charts to see if individual investors have gotten too bullish too quickly in a still split market.
Stocks have continued higher from last Thursday's lows when the technical indicators suggested a rally was imminent. The Spyder Trust (SPY) has rallied 2.2% from the lows, which has taken it back to initial resistance.
In last week's comments (Are the Fear Levels Really That High?) I discussed the extremely low reading of CNN's Fear & Greed Index which has dropped to 4. Since the Index ranges from 0 to 100 this was quite a low reading. As of Wednesday's close, the Index has risen slightly to 9.
This week's data on the individual investor data from AAII indicates they have gotten quite a bit more bullish in the past week. The bullish percentage jumped from 30.89% to 39.81% last week, while the number of bears dropped sharply from 38.23% to 26.96%.
This reversal in sentiment is consistent with a rebound in a downtrend and not the resumption of the major uptrend. There have been some positive signs as the A/D ratios were stronger than prices on both Monday and Wednesday. Also, there are signs that biotechnology (see iShares Nasdaq Biotechnology (IBB)), a key market leading sector, is close to completing its corrective pattern.
So what is an investor or trader to do?
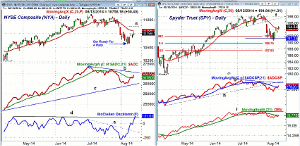
Chart Analysis: After Monday's apparent rally failure in the NYSE Composite, Wednesday's action was a short-term positive.
- The 20-day EMA is at 10,798 with more important resistance in the 10,850 area (line a).
- A strong close above 11,015 would clearly be a short-term positive.
- The A/D came close to its longer-term support (line c) last week.
- The A/D line is back above its WMA but it still has key resistance at line b.
- This is the bearish divergence resistance that warned of the top in July.
- The McClellan oscillator broke its short-term downtrend, line e, last Friday.
- The longer-term resistance, line d, and the zero line have now been overcome.
- The monthly projected pivot support is at 10,599 with further in the 10,500 area.
The Spyder Trust (SPY) dropped into the support zone last week as it had a low of $190.55.
- This low was between the short-term 38.2% and 50% Fibonacci support levels from the April lows.
- The quarterly pivot at $191.24 continues to hold on a weekly closing basis.
- The S&P 500 A/D line has moved back above its WMA but still has important converging resistance at lines g and h.
- A strong move above this resistance is needed to signal that a new uptrend has begun.
- The daily on-balance volume (OBV) is acting weaker than the A/D line as it is just barely above its WMA.
- The OBV has key resistance still at line i.
- Wednesday's close was above the 20-day EMA but just below the monthly pivot at $195.04.
- The next band of resistance is in the $195.78 to $196.16 area.
- A strong close above the former uptrend, line f, at $197.60 would be positive.
What it Means: In reviewing a number of sectors and charts it is still clearly a split market.
Some have completed short-term top formations (3 Reasons To Sell) and could drop to new correction lows on the next market pullback.
Other stocks-like some of the consumer and energy stocks-appear to have already completed their bottom formations. They will need to hold support if the market averages drop back to last week's lows.
The Powershares QQQ Trust (QQQ) is still acting stronger than the S&P 500 but the daily studies have not yet signaled that the correction is over.
I will be watching intra-day action closely for signs of a rally failure in the next three to five days, so keep an eye on my Twitter feed.
How to Profit: No new recommendation.


