In a week jam-packed with economic data, the Asian ETFs are looking strong while European ETFs have been correcting for several weeks, so MoneyShow's Tom Aspray takes a technical look at the charts to see if this signals a change in the outlook for the Euro zone countries.
Monday's fairly quiet trading may be the exception rather than the rule for the rest of the week. The minor 0.13% gain in the Dow Industrials was offset by the 1.13% drop in the Dow Transports. The early selling was well absorbed as the S&P 500 had an intra-day low of 1967.31 but then closed barely higher at 1978.91.
The ADX analysis indicates that the market leading PowerShares QQQ Trust (QQQ) is no longer trending. This is similar to what occurred in late April and early May before the QQQ started to trend higher. The marginally higher close Monday has caused some improvement in the OBV on the Spyder Trust (SPY) but this is not yet supported by the A/D line analysis.
The Pending Home Sales data put further pressure on the home building stocks as the iShares US Home Construction ETF (ITB) was down 1.25%. It was one of the four ETFs that have recently generated quarterly pivot sell signals.
This is a week loaded with economic data as we get new data on home prices and consumer confidence today. It is the GDP data on Wednesday that will likely set the stage for Friday's job report.
Looking overseas, the Asian ETFs are looking strong while the European ETFs have been correcting for several weeks. Does this change the outlook for the Euro zone countries or is this just a normal correction?
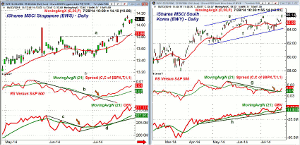
Chart Analysis: The iShares MSCI Singapore (EWS) is up 3.75% in the past month but just 8.57% YTD.
- EWS formed a daily doji last Thursday and triggered a LCD on Friday.
- The daily chart shows that it took two attempts before the resistance in the $13.80 area (line a) was decisively overcome.
- This now represents first good support along with the 20-day EMA at $13.86.
- The quarterly pivot resistance is at $14.56 with tentative monthly projected resistance for August at $14.61.
- The daily relative performance broke its downtrend from the May highs, line b, in early July.
- The RS line is holding well above its WMA but the weekly (not shown) has not yet overcome the resistance from early in the year.
- The daily OBV started a new uptrend in early July after breaking its downtrend, line c.
- The OBV is still rising strongly and the weekly is acting stronger than prices.
South Korea's Kopsi Index gained 0.7% Monday and the daily chart of the iShares MSCI South Korea (EWY) shows a strong upward trading channel, lines e and f.
- EWY is just up 2.27% YTD as it dropped sharply in March.
- The quarterly pivot resistance at $68 corresponds nicely to the upper trading channel (line e).
- In 2007, EWY had a high of $69.70 but then dropped 56% in 2008.
- The daily downtrend in the relative performance, line g, was broken last week.
- The RS line has turned up sharply from its WMA.
- The daily on-balance volume (OBV) has been moving gradually higher since April, line h.
- The weekly OBV (not shown) has been above its WMA since the middle of February.
- Monday's gap higher leaves minor support at $65.50-65.70 with the 20-day EMA at $65.
- The quarterly pivot is at $64.24 and represents more important support.
NEXT PAGE: Two European ETFs to Watch
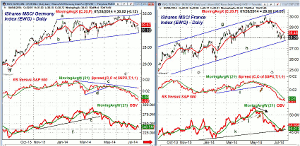
|pagebreak|The iShares MSCI Germany Index (EWG) has formed multiple peaks in the $31.70 range since early June.
- EWG is down 3.84% over the past month and has declined 3.57% so far YTD.
- The support going back to last fall's lows, line b, is now being tested.
- The quarterly S1 support at $30.26 is now being tested with the S2 support at $29.78.
- The 38.2% Fibonacci support from the April 2013 low is at $28.28.
- The RS line broke its two month uptrend, line d, in mid-May.
- This confirmed the divergence in the relative performance that had been forming since January, line c.
- The daily OBV broke its six month uptrend, line e, in late April.
- The OBV continued to diverge as EWG was making its high and the OBV is now back to strong support (line f).
- The weekly OBV (not shown) has stayed in a tight range and its WMA is flat.
- EWG closed Monday well off the lows with next resistance at $30.67 (20-day EMA) and the quarterly pivot at $30.76.
- There is much stronger resistance in the $31.20 area.
The iShares MSCI France Index (EWQ) has been hurt by the countries lackluster economic data as it has lagged the rest of the Euro zone for the past three quarters.
- EWQ peaked at $30.10 on June 6 and is now down 6.7% from its high.
- The uptrend, line h, that goes back to the September 2013 lows, is now being tested.
- The quarterly support levels have been broken with the February low at $25.87.
- The declining 20-day EMA is at $28.48 with the quarterly pivot at $29.13.
- The relative performance did not confirm the early June highs but then broke support at line i.
- The daily OBV formed a negative divergence at the highs (see arrow) and broke support at line j, two days before the highs.
- The OBV has reached long-term support at line k and has moved back above its WMA.
- The weekly OBV has dropped below its WMA, which is a negative sign.
- There is minor resistance now at $28.69 with the quarterly pivot at $29.13.
What it Means: The positive action in many of the Asian markets, including China, is a positive sign for the global equity markets. I think this is a precursor to steadily improving economic data out of the region.
I continue to like the previously recommended Vanguard Pacific Stock Index (VPL), which is up 8% over the past three months. It has 55% in Japan, 20% in Australia, and just over 11% in Korea. Its broad diversification makes it more immune to the shocks that often hit the individual country ETFs. Their risk is generally a bit higher as is the potential reward.
I will be watching the Asian country ETFs, including the iShares MSCI Malaysia Index (EWM), which also appears to have bottomed.
I think the decline in the Euro country ETFs is just part of a global rotation so I will be looking for strong signs that they have bottomed out.
How to Profit: No new recommendation.
Related Reading
4 Quarterly Pivot Sell Signals
The Week Ahead: Bond Market Mystery Solved


