Several key ETFs have now had weekly closes below the quarterly pivot levels—consistent with an intermediate-term trend change—so MoneyShow’s Tom Aspray examines the charts to see what other technical indicators are saying about them.
The Dow Industrials was lower last week while the Nasdaq 100 managed a slight gain and on the NYSE there were more stocks declining last week. This week’s close could give us some insight for the month of August.
Another 140 S&P 500 stocks report earnings this week along with several key economic reports including the FOMC meeting and the monthly jobs report. The market will be watching the Pending Home Sales Index this morning, especially after last week’s sharp decline in new home sales.
There were quite a few earnings casualties last week led by double digit drops in Amazon.com (AMZN), Angie’s List (ANGI), and D.R. Horton (DHI). As I noted last week, AMZN was in a high risk zone and therefore, if you are holding stocks that report this week, now is a good time to review their charts.
The daily technical studies have a slight downward bias after Friday’s drop. The market needs a couple of sharply higher closes early this week to reverse the deterioration. The S&P futures formed a doji last week so a Friday close below 1959 would trigger a weekly low close doji sell signal.
Several key ETFs have now had weekly closes below the quarterly pivot levels that I published in early July (see table). This is consistent with an intermediate-term trend change as the Spyder Trust (SPY) has not had a weekly close below its quarterly pivot since December 2012. So, what are the other technical indicators telling us about these ETFs?
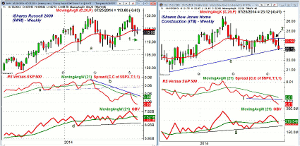
Chart Analysis: The iShares Russell 2000 Index (IWM) closed below its quarterly pivot at $115.05 on July 18.
- IWM tried to rally last week but it stalled at the 20-day EMA which stands at $115.11.
- The monthly projected pivot support is at $113.21 with the quarterly support at $110.74 (point 1).
- The weekly chart has major support for the year now at $107 (line a).
- The weekly relative performance dropped below strong support, line c, in early April.
- The RS line subsequently formed sharply lower lows, line b, consistent with a market lagging sector.
- The weekly OBV made new highs in early July but the daily OBV did not.
- The weekly OBV is now below its WMA with more important support at line d.
- There is initial resistance now in the $114.50-$116 area.
The iShares Dow Jones Home Construction ETF (ITB) has had a major reversal from the early July high.
- Its close at $23.83 on Friday, July 11 was below the quarterly pivot at $24.22.
- The uptrend going back to the 2013 lows, line e, is now being tested.
- Last Friday’s close was just slightly below the quarterly S1 support at $23.17.
- In May, ITB had a low of $22.56, which is the next key level to watch.
- The weekly relative performance tested but failed to move above its WMA four weeks ago.
- The weekly RS line has now dropped to new lows as support (line f) was broken.
- The weekly on-balance volume (OBV) rose above its WMA in late May but dropped back below it last week.
- There is initial resistance at $23.50 with the 20-day EMA at $23.90.
NEXT PAGE: Two More ETFs to Watch
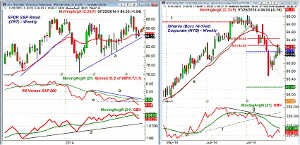
|pagebreak|The SPDR S&P Retail ETF (XRT) was able to exceed the late 2013 high in early July as it reached $88.73.
- The bearish reversal the following week resulted in a close below the prior week’s low.
- The quarterly pivot at $84.77 was violated two weeks ago but not on a weekly closing basis.
- XRT’s close at $84.33 on Friday was below the pivot (see arrow).
- The uptrend that goes back to the February 2014 lows, line a, is at $83.77.
- There is quarterly S1 support at $82.21 with the April low at $79.96.
- The weekly relative performance briefly moved above its WMA in early July before reversing.
- The RS line dropped below support, line c, two weeks ago.
- The weekly OBV formed a pattern of higher highs going into the July highs but has now dropped below its WMA.
- The daily OBV (not shown) dropped below its WMA on July 10.
- The declining 20-day EMA is at $85.40 with further resistance at $86.30.
The iShares iBoxx High Yield Corporate Bond (HYG) peaked on July 1 at $95.03 and closed last Friday at $94.04.
- HYG rebounded back to its 20-day EMA and the 50% Fibonacci retracement resistance last week.
- But Friday’s close was still below the quarterly pivot at $94.10.
- There is initial support now at $93.70 with the recent low at $93.48.
- The quarterly projected pivot support is at $93.20 with monthly support at $91.86.
- The daily OBV peaked in early June and then formed much lower highs, line g, in early July.
- This negative divergence was confirmed by the drop below support (line f) on July 9.
- HYG closed that day on $94.61.
- The weekly OBV (not shown) is still holding above its WMA.
What it Means: The negative readings in the Russell 2000 Advance/Decline line (see chart) supported the weak relative performance analysis. There are no signs yet of a bottom for IWM as it needs a strong close back above $118.
The weakness in both the iShares Dow Jones Home Construction (ITB) and SPDR S&P Retail ETF (XRT) may be a sign that the consumer is not spending. This week’s data on the consumer may tell us more.
The increase in junk bond yields and the fund flows out of this sector may be warning of higher rates as it did in May 2013.
How to Profit: No new recommendation.
Portfolio Update: Long positions in the iShares Dow Jones Home Construction ETF (ITB) from $24.90 stopped out at $23.67.
For SPDR S&P Retail ETF (XRT), longs from $84.01 were stopped out at $85.21 as the stop was raised on the move above $87.60.
Related Reading
The Week Ahead: One Bubble Starting to Burst?


