The selling was heavy in a number of already vulnerable stocks this week, so MoneyShow’s Tom Aspray takes a technical look at several of these high volume decliners to determine if they could still move lower.
The fragile status of the stock market as we started the week made it especially vulnerable to Thursday’s global developments. The major averages had their largest losses since April with both the Dow Transports and Nasdaq 100 losing 1.41%. Even more severe were the 2+% loses in the banking and homebuilding sectors.
The market internals were over 4-1 negative, which has added to the deterioration that was already evident last week Should You Reconsider Buying the Dip?. The NYSE A/D line has now dropped below the June 24 lows. Therefore, the Spyder Trust (SPY) could eventually decline to its quarterly pivot at $191.24. This is just over 2% below Thursday’s close.
The selling this week has been heavy in a number of stocks as some have been lagging the market for the past few months. The volume analysis (see Volume Always Precedes Price) had warned that these stocks were vulnerable. The extent of the selling suggests that they can still move lower so keep an eye on these high volume decliners.
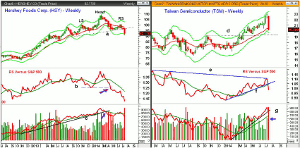
Chart Analysis: Hershey Foods Corp. (HSY) looks ready to close the week well below the neckline of a head and shoulders top formation.
- The left shoulder (LS) was formed last fall and HSY then surged to a new high at $108.15 in late February.
- The weekly starc+ band was tested before it started an eight week decline to a low of $94.64.
- The rally forming the right shoulder (RS) was weak as HSY just barely made it above its 20-week EMA.
- The distance from the Head to the neckline gives downside targets in the $82-$84 area.
- The weekly relative performance dropped below major support at line b, in early May.
- This warned of the recent decline as the RS line is now dropping sharply.
- The OBV just barely made it above its WMA during the spring but dropped back below it last week.
- HSY opened the quarter below the pivot at $98.72 with first resistance now in the $94.60-$95 area.
Taiwan Semiconductor (TSM) tested its weekly starc+ band over the past two weeks as it reached the quarterly pivot resistance at $22.64.
- Last week, TSM formed a doji so a weekly low close doji sell signal will be triggered this week as TSM is well below the doji low of $21.81.
- The 20-week EMA is now being tested with quarterly pivot support at $19.68.
- The weekly chart shows additional support in the $18.90 area, line d.
- The weekly RS line did not make a new high this year, line e.
- This divergence will be confirmed by the drop below its uptrend, line f.
- The volume this week has been heavy but the weekly OBV is still above its WMA.
- The daily OBV (not shown) did not confirm the recent highs and has dropped below the June lows.
- The monthly pivot is at $20.81 with the declining 20-day EMA and further resistance at $21.51.
NEXT PAGE: Another High Volume Declining Stock to Watch
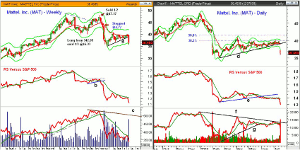
|pagebreak|Mattel, Inc. (MAT) was down 6.6% Thursday as their revenue dropped 9% and their adjusted revenues fell 86%.
- MAT has had a rough year as it is down 21.8% YTD.
- As noted on the chart, MAT was recommended last fall at $42.09.
- One third was sold at $46.33 and half of the remaining position was sold at $47.37.
- The remainder of the position was stopped out at $44.77 as MAT eventually plunged to a low of $34.64 in February.
- The weekly relative performance dropped below support, line b, in the first week of 2014.
- The RS line continued to decline as the weekly starc- band was tested.
- The weekly chart shows that, after trading sideways for five months, TSM broke support at line b this week.
- The weekly starc band is being tested with quarterly projected pivot support at $34.65.
- The weekly on-balance volume (OBV) formed a negative divergence at the late 2013 highs, line c.
- The OBV then dropped sharply below its WMA in early January.
The daily chart of Mattel, Inc. (MAT) reveals a formation that typically develops after a sharp decline.
- The rally made it just above the 38.2% Fibonacci retracement resistance at $39.36 in April but failed below the 50% resistance at $40.82.
- The bear flag formation was completed with the drop below the support at line d.
- The 127.2% Fibonacci retracement target is at $33.09.
- The daily relative performance dropped below its support, line e, in May.
- This made it clear that MAT was acting weaker than the overall market.
- The daily OBV broke its uptrend, line g, in May and then rebounded back to resistance (line f).
- The volume of over 15 million shares Thursday was almost six times the average of 2.6 million.
- The close below the daily starc- band suggests that prices should stabilize in the next few sessions.
What it Means: Some of the big tech stocks like Microsoft, Inc. (MSFT) and Intel Corp. (INTC) helped push the overall market higher early in the week. However, many stocks did not participate and this was a sign to take some profits as the market was moving higher.
The futures are higher in early trading but the S&P futures have strong resistance now in the 1960-1965 area. If the market does end the day lower, then an oversold rally is likely by the middle of next week.
How to Profit: No new recommendation.


