Investors and traders wonder if Tuesday’s momentum stock damage indicates the beginning of another punishing decline or if it’s a bear trap, so MoneyShow’s Tom Aspray takes a technical look at some key markets to clarify the current outlook.
It was a rough start for the stock market on Tuesday, especially for the widely watched, so-called “momentum stocks.” Another market warning, this time from an institutional analyst, helped to sour investor sentiment.
The negative comments from a hedge fund manager in April came just a few days before the market bottomed. The S&P 500 and Dow Industrials were down less than 0.75% Tuesday while the Nasdaq Composite lost 1.35%. The market internals at 3-2 negative were not that bad with the ARMS Index closing at 1.58 which is moderately oversold. In reaction to the comments in April, it hit a high of 2.37.
The damage was more severe in the momentum stocks as the Global X Social Media ETF (SOCL) lost 4.16% led by a 7% loss for Twitter, Inc. (TWTR) and a 3.7% drop in Facebook, Inc. (FB).
The Spyder Trust (SPY) and NYSE Composite are now testing their 20-day EMAs which is characteristic of normal market correction. The market is looking to this afternoon’s release of the FOMC for further hints of the Fed’s policy.
Investors and traders are wondering whether this is the start of another punishing decline for the social media stocks that will precede a deeper market correction or is it a bear trap that is setting the stage for further new all time highs. A technical look at some of the key markets will help clarify the current outlook.
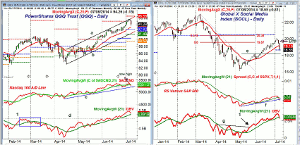
Chart Analysis: The PowerShares QQQ Trust (QQQ) tested the upper boundary of its trading channel (line a) for three days before Tuesday’s drop.
- The 20-day EMA is at $93.41 with the monthly pivot at $92.62.
- If these levels are reached it should set the stage for a rebound.
- The monthly projected pivot support (courtesy of John Person’s software) is at $91.49.
- Last week I noted that the Nasdaq 100 A/D line had not confirmed the recent highs.
- This divergence was resolved last week as the A/D line made another new high.
- The A/D line has dropped below its WMA but is still well above the June lows and the uptrend, line c.
- A drop below this support would warn of a deeper correction.
- The daily on-balance volume (OBV) has made a convincing new high in July.
- In contrast, last February and March, the OBV was diverging from prices (see box) which warned of a further decline.
- The OBV has strong support now at line d.
- There is converging pivot and starc+ band resistance in the $96.80-$97.40 area.
The Global X Social Media Index (SOCL) has 27 holdings with an expense ratio of 0.65% and an average volume of 214K shares.
- SOCL made a high in March of $22.99 on March 7 before dropping 29.9% to a low of $16.12.
- Last Wednesday, SOCL hit a high of $20.10 as it reached the resistance zone formed by the 50% and 61.8% Fibonacci resistance levels.
- The following day, SOCL also formed a doji and a LCD sell signal was triggered on Monday.
- The quarterly pivot at $18.65 is now being tested with further support at $18.12 (line e).
- There is more important support in the $17-$17.46 area.
- The relative performance had a feeble rally from the May lows and broke its uptrend, line f, on Tuesday.
- The daily OBV completed its bottom formation on May 23 when SOCL closed at $17.64.
- The OBV did make a new rally high with prices but dropped below its WMA Tuesday.
- There is first resistance now at $19.48-$19.65.
NEXT PAGE: 2 More Stocks to Watch
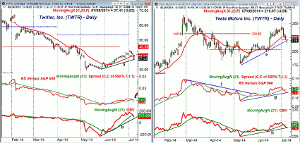
|pagebreak|Twitter, Inc. (TWTR) has had a rough year as it is down 41.2% YTD as it peaked on December 26 at $74.73.
- In early March, it had a low $29.51 and it peaked last week at $42.95.
- Even though this 45% rally from the lows was impressive, it has all the characteristics of a rally within a larger downtrend.
- The rally has stalled so far below the 38.2% Fibonacci retracement resistance (Master the Basics) at $45.39.
- A Friday close below the quarterly pivot at $39.36 would be negative.
- The RS line formed a shallow uptrend from the June lows but has now dropped back below its WMA.
- The weekly relative performance (not shown) has turned down after testing its declining WMA.
- The daily OBV has dropped back below its rising WMA but it could take a few more days before a top is completed.
- There is resistance now in the $40.11-$41.45 area.
Tesla Motors, Inc. (TSLA) has had an impressive rally from the May low of $177.22 but is still below the February 26 high of $265.
- The 61.8% Fibonacci retracement resistance at $231.52 was overcome, which is a positive sign.
- However, TSLA is currently trading below the quarterly pivot at $220.59.
- The close Tuesday was well above the lows with further support in the $211-$214 area. which includes the monthly projected pivot support.
- The relative performance shows a pattern of higher highs but has now dropped back to its uptrend, line g.
- The weekly RS line (not shown) is still holding above its WMA.
- The daily OBV has also dropped below its WMA and is now testing its support (line h).
- The strength of any rally from current levels will be important as it could generate an AOT buy signal.
- The 20-day EMA and the first strong resistance is now at $225.37.
What it Means: In April, I made the case why investors should avoid momentum stocks as the risk control is very difficult. The technical outlook for Global X Social Media Index (SOCL) and Twitter, Inc. (TWTR) indicates they are still vulnerable to a further decline. The outlook for Tesla Motors, Inc. (TSLA) is more positive and I would look for the $211-$214 area to hold.
As for the overall market, there are no convincing signs yet the market has formed or is forming a significant top. Just like a super tanker, it takes time to turn the market’s trend. The strength of next rally will tell more and further new highs cannot be ruled out.
The next couple of weeks will be important as the market has a seasonal tendency for weakness at the end of July (see chart). Stronger warning signs would be generated if the NYSE Advance/Decline drops below both of the June lows and the OBV starts to develop a new downtrend.
How to Profit: No new recommendation.


