Even though trading may be thin today since tomorrow is the Fourth of July, MoneyShow’s Tom Aspray offers a technical analysis of the NYSE New Highs and New Lows to help traders get prepared for the beginning of earnings season next week.
The stock market closed mixed ahead of the monthly jobs report. The weaker than expected Factory Orders apparently were cancelled out by the stronger than expected ADP Employment Report. Most seem to be counting on a good jobs number later today and a weaker number would further confuse many investors.
Those stock pickers who have been on the sidelines, or short, for the past six weeks have had a rough time but they may get some relief in the next few weeks. The broad market still looks strong based on the new highs in both the weekly and daily NYSE Advance/Decline lines but that does not mean we won’t see some sector rotation.
The utility stocks look ready to close the week lower as the Select Sector SPDR Utility (XLU) was down 1.94% on Wednesday. The 3rd quarterly pivot point data did show that this was one sector ETF that was closest to its pivot so this level will need to be watched in the coming weeks.
The trading is likely to be thin Thursday but a technical review as we head into the weekend will help you be prepared for next week’s start of the earnings season.
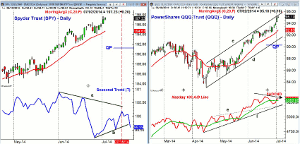
Chart Analysis: The daily chart of the Spyder Trust (SPY) shows the tight range but higher close on Wednesday. Tuesday’s intra-day high at $197.63 was not exceeded.
- The SPY is almost 1% above the rising 20-day EMA at $195.45 with the monthly pivot at $194.42.
- The monthly projected pivot support for July is at $192.35 with the quarterly pivot (QP) at $191.21.
- The daily seasonal analysis always needs to be consistent with the technical studies before one considers taking a position.
- The plot shows that in May we typically see a sideways seasonal pattern but this was trumped by the strong technical readings since mid-May.
- The lower highs in June’s seasonal trend also did not hold true.
- Typically, SPY is weak at the end of July as it tends to peak on July 15 with the uptrend, line b, being broken later in the month.
The PowerShares QQQ Trust (QQQ) is up 14.5% from the April lows as the upper boundary of the trading channel (lines c and d) is now being tested.
- There are several pivot and starc+ band targets in the $96.80-$97.61 area.
- The QQQ is currently 2.4% above its rising 20-day EMA at $92.83, which also corresponds to the monthly pivot.
- The new quarterly pivot stands at $90.23.
- The Nasdaq 100 Advance/Decline line peaked on June 18 and formed a lower high early this week (see arrow).
- A decline below both the late and early June lows would signal a drop to converging support at lines e and f.
- The daily on-balance volume (OBV) has made new highs this week.
- The weekly OBV (also not shown) has also confirmed the new highs.
NEXT PAGE: The NYSE New Highs and New Lows Analysis
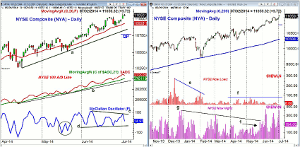
|pagebreak|The NYSE Composite (NYA) shows the New Highs this week, which was not far below the quarterly R1 resistance at 11,245.
- The 20-day EMA was tested a week ago and is currently at 10,928.
- The daily uptrend, line a, is in the 10,830 area with the quarterly pivot at 10,758.
- The NYSE Advance/Decline made further new highs this week but turned a bit lower Wednesday.
- The A/D line is well above both its strongly rising WMA and support at line b.
- The McClellan oscillator has been range bound for most of the year.
- It did form a short-term bullish divergence at the May lows (see circle).
- The OSC did not make a new high Tuesday and has formed lower highs, line c.
- There is OSC support to watch now at line d.
The NYSE New High and New Low analysis can often be helpful in identifying key turning points, especially when it is consistent with confirming signals from other technical studies.
- The number of New Lows peaked in December and formed a much lower high at the February lows, line e.
- This was a positive sign, which corresponded with an oversold reading from the ARMs Index.
- Since March, the New Lows have been in a trading range, line f, and a rise in the New Lows above 100 may warn of heavier selling.
- On the other hand, the number of New Highs diverged at the early March highs, line g.
- This was apparently warning of the choppy trading range that was not resolved until the latter part of May.
- The surge in the New Highs to 227 on May 27 was consistent with a strengthening market.
- The downtrend, line g, was broken in early June and the New Highs is still acting strong.
What it Means: The action over the next few weeks should be watched closely in light of the divergences in the Nasdaq 100 A/D line. If this divergence is confirmed, it may be a warning of a deeper correction in the overall market.
The warning of a deeper correction in the NSYE Composite would be several consecutive days of quite negative A/D numbers.
How to Profit: No new recommendation.


