MoneyShow's Tom Aspray illustrates how third quarter pivot levels can be used to identify potential trend changes, plus key support and resistance levels, and he also takes a technical look at how four ETFs have done so far this year.
The major averages accelerated to the upside Tuesday starting off the new month and quarter on an impressive note. CNBC's Most Hated Bull Market has continued to surprise many and this sentiment, repeated ad nauseam, is a plus for the stock market.
The market internals were better than 2-1 positive as the A/D lines for both the NYSE and S&P 500 made further new highs. The NYSE McClellan oscillator has risen to +83 and has broken the short-term downtrend noted in last week's technical review.
The Nasdaq 100 and S&P 600 led the market higher but the home builders also did quite well as the iShares Dow Jones US Home Construction ETF (ITB), recommended before the opening, closed up 1.4%.
Much of the market chatter after the close was focused on the Dow Industrials, which stayed below the 17,000 level again. Market bears pointed to this as the third rally failure for the Industrials as it failed to overcome it for the third time. They disregarded the new closing high for the Industrials and completion of the flag formation by the market leading Dow Transports.
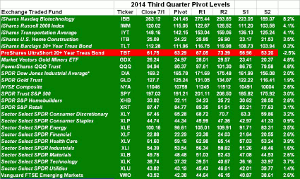
I believe that the third quarter pivot levels are likely to be more important for both traders and investors. The table above can be used for the entire quarter to identify potential trend changes as well as both key support and resistance levels.
Often, weekly closes above or below the quarterly pivots can signal a change in the trend and help you identify the emerging sectors. Let's look how they have done so far in 2014.
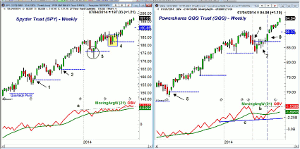
Chart Analysis: As I have discussed in prior articles, the Spyder Trust (SPY) did not have a weekly close below its quarterly pivot in 2013.
- The chart shows that, last July, the SPY closed the first day of the new quarter above its pivot at $158.12 (point 1).
- In October 2013, SPY dropped below the quarterly pivot at $164.85 as it hit a low of $162.15 during the week (point 2) but closed the week at $167.79.
- The sharp decline in early February took the SPY to a low of $172.12 but it closed the week at $178.04, which was above the quarterly pivot of $177.97.
- The week ending April 11, SPY closed at $180.64, which was below the second quarter pivot at $182.12 (point 3).
- This signal was reversed the following week as SPY closed at $185.50 (point 4).
- For the third quarter the pivot is at $190.89 with the R1 resistance at $201.11.
- During the second quarter, the R1 resistance at $192.79 was exceeded.
- The weekly OBV broke out to the upside at the end of May as resistance, at line a, was overcome.
The Powershares QQQ Trust (QQQ) has been much more volatile in 2014 after a strong uptrend in 20913.
- The QQQ also opened the third quarter above its pivot at $70.02 (point 1) and staged an impressive six week rally.
- In the fourth quarter the pivot at $75.70 was briefly violated with a low of $75.42.
- The QQQ closed the first day of the second quarter above the pivot at $87.11 but closed the week below it at $86.14.
- Two weeks later it had a low of $83.06, which was just below the quarterly S1 support at $83.59.
- Two weeks later it closed above the pivot (point 7) but the following week closed back below it.
- This negative signal was reversed with the weekly close on May 16 at $87.47.
- The QQQ accelerated to the upside the following week (point 8).
- Before the quarter was over the QQQ came quite close to its R2 resistance at $95.44.
- This quarter, the R1 resistance is at $97.61.
- The weekly OBV is challenging the early 2014 highs, line b, but has not broken above it yet.
- The strong OBV support at line c held during the spring decline.
NEXT PAGE: Two More ETFs That Started Fourth Quarter Impressively
|pagebreak|The Select Sector SPDR Utilities (XLU) led the sector parade so far in 2014 as I reviewed in 4 of the Year's Best Sector ETFs.
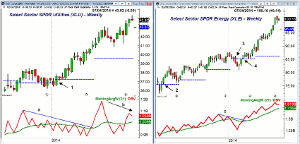
- XLU closed the first day of 2014 at $36.77, which was below the pivot at $37.26.
- At the end of the second week of 2014, XLU closed at $37.58 (point 1), which was well above its pivot.
- Since this positive signal, the XLU has stayed well above its quarterly pivot.
- The second quarter R2 resistance at $44.57 was almost reached on Monday when the high was $44.36.
- The on-balance volume (OBV) broke its downtrend, line a, in early April and surged sharply.
- The OBV has not yet confirmed the new highs (line b).
- The daily OBV (not shown) is positive but is overextended, so a short-term top may be in place.
- The third quarter pivot stands at $43.19 with the S1 support at $42.01.
The Select Sector SPDR Energy (XLE) is up 12.3% in the past three months as it closed the first day of the new quarter at $100.16, which was well above the third quarter pivot at $96.61.
- The week ending May 3, 2013, XLE closed at $77.98, which was above the quarterly pivot at $75.53.
- During the third quarter of 2013 XLE stayed well above its pivot.
- In the first week of the fourth quarter of 2013 XLE traded below the quarterly pivot at $81.17 but did not close the week below it.
- In early 2014, XLE turned lower and on January 17 closed at $85.19, which was just above the quarterly pivot at $85.18.
- The following week's close at $83.53 (point 3) was well below the pivot.
- Two weeks later, XLE hit a low of $81 before rebounding.
- On Friday, February 21, 2014, XLE closed at $85.59 which was just above the pivot.
- XLE gapped higher the following Monday as it opened at $85.85 and by the end of June was up 16.6% from this opening price.
- One week after XLE closed above its pivot, the OBV broke its downtrend, line c, as it was already above its WMA.
- The OBV has continued to make new highs and is well above its rising WMA.
What it Means: As I do each quarter, I suggest you print out a copy of the pivot table to use for the next three months. In addition to signaling changes in trend by weekly closes above or below the pivot, the support and resistance levels can also be helpful in entering or exiting positions.
The Select Sector SPDR Consumer Staples (XLP) had a high on June 29 of $45.51, which was just above the quarterly R2 resistance at $45.29. XLP has subsequently had a low of $44.58.
Only the Proshares Ultra Short 20+ Year Treasury (TBT) is trading below its quarterly pivot though it was up 1.7% Tuesday (it is part of the Charts in Play portfolio).
The iShares Barclays 20+ Year Treasury Bond ETF (TLT) is just 0.3% above its quarterly pivot. The Select Sector SPDR Consumer Staples (XLP), Select Sector SPDR Utilities (XLU) and Select Sector SPDR Industrials (XLI) are 2% or less above their quarterly pivots.
How to Profit: No new recommendation.
Portfolio Update: Should be 100% long the Spyder Trust (SPY) at $185.02. Use a stop at $185.83 and sell 1/3 at $199.35 or better.
Should be 50% long PowerShares QQQ Trust (QQQ) at $86.88 or better. Use a stop at $86.47 and sell 1/3 at $97.30 or better.


