The bond market has proven stronger than anybody expected this year, thus clobbering the bond bears, but MoneyShow’s Tom Aspray makes the technical case for why yields might be bottoming out now and prices might be headed higher.
As the Dow Industrials challenge the 17,000 level, the debate on Wall Street continues as those who have been caught on the wrong side of this market try to rescue their portfolios before the end of the quarter. Some argue that the low VIX readings are warning of too much complacency while others argue that it is a bullish sign that means the market can move even higher.
The German Dax also made a new all-time high in Monday’s session and it has added to these gains in early trading Tuesday. The regional banks were one of the star performers as the SPDR S&P Regional Banking ETF (KRE) was up 1.55%. On the downside, the REITs had a rough day with the retail and residential REITs losing almost 1.5%.
There were technical signs that the REITs were vulnerable in last month’s Yield Chasers Watch Out, so the drop was not surprising. Overall, the first five months have been tough for bond traders as the market was one sided as the year started.
The stock index futures are a bit lower in early trading and the major averages are overextended on a short-term basis. The NYSE Composite did exceed its monthly projected pivot resistance at 10,920 in Monday’s session. A pullback would improve the technical outlook and could take some of the materials stocks I recently recommended into my buying zones.
The heavy short position in the bond market early in the year meant the market was quite one sided and again those that followed the crowd ended up losing. It seems like the sharp rise in bond prices and drop in yields two weeks ago may have cleaned out even the most stubborn bears. According to Bloomberg, the short position of hedge funds and large speculators has dropped from over 162,000 contracts in April to just over 43,000 in early June.
Here are some technical reasons why bonds may be topping and yields may have already made their lows.
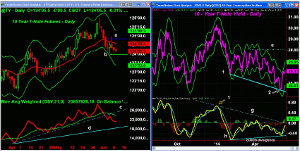
Chart Analysis: The daily chart of the continuous futures contract of the 10-year T-note contract had a high of 126 on May 29 before closing at 125 20/32.
- The reversal from the high was sharp as the low at 124 1/32 was quite close to the monthly projected pivot support at 123 30/32 (line b).
- The declining 20-day EMA is now at 124 18/32 with the monthly pivot at 125 11/32.
- The daily starc+ band is at 125 9/32 with further at 125 16/32.
- The daily OBV dropped below its uptrend (line c) and its WMA two days after the highs.
- The OBV is below its declining WMA and has stronger support at line d.
- A break below the support at 123 27/32 would support the bearish outlook.
The daily chart of the 10-year T-note yield dropped to a low of 2.43% the week of May 27. At the end of the week, the close was reported at 2.473%, which was just above the key level of 2.470% that I was watching.
- Subsequent analysis of other data sources suggested the close was closer to 2.460% (point 2) as the daily starc- band was tested.
- Yields have quickly rebounded; closing on Monday at 2.613%.
- The daily starc+ band is at 2.687% and a strong close above 2.800% would be a sign that rates are moving higher.
- Though yields made lower lows, the MACD did not as it formed higher lows, line h.
- A move above the downtrend, line g, and the early April high would confirm the bullish divergence.
- In early 2014, the high in yields was not confirmed by the MACD (point 1) as it formed a bearish divergence.
NEXT PAGE: Trading a Bond Market Top
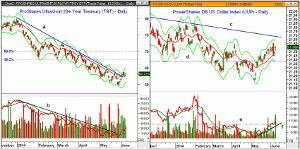
|pagebreak|The ProShares Ultrashort 20+ Year Treasury (TBT) is a double inverse ETF, which peaked in January at $80.28.
- At the recent low of $59.54, it was down over 25% from the year’s high.
- The daily chart shows that the downtrend, line a, was broken last week.
- The daily starc+ band was tested as TBT came close to the monthly projected pivot resistance at $63.85.
- There is initial resistance at $63.60 with further in the $64 area.
- The 38.2% Fibonacci retracement resistance is at $67.41 with the 50% resistance at 469.86.
- The daily OBV moved above its downtrend and WMA at the end of May.
- It is now above its rising WMA and the weekly OBV (not shown) could move above its WMA this week.
- There is minor support now in the $62-$62.40 area with the monthly pivot at $61.69.
The PowerShares DB US Dollar Index (UUP) tracks the Deutsche Bank Long US Dollar futures index and has an expense ratio of 0.82%.
- UUP opened the year pretty much where it closed Monday as last week’s high of $21.60 was quite close to the monthly projected pivot resistance at $21.62.
- In 2012, UUP had a high of $23.14.
- The 20-day EMA is now at $21.45 with the monthly pivot at $21.38.
- The monthly projected pivot support is at $21.23 with the early May low at $21.14.
- The volume was strong Monday but the OBV had already broken through resistance, line e, last week.
- The daily OBV shows a short-term uptrend, line f.
- The weekly OBV (not shown) is now above its WMA, which is flattening out.
What It Means: A rebound in bonds and a pullback in yields look likely over the near term but this should provide a low-risk opportunity to buy the ProShares Ultrashort 20+ Year Treasury (TBT).
My analysis of the iShares 20+ Treasury Bond ETF (TLT) also suggests it is topping and a rebound should fail. It has many similarities to the T-note futures.
Those who have a long maturity bond portfolio should consider shortening the maturity so that it will be less vulnerable to an increase in rates.
If rates are indeed going to move higher, it should be positive for the dollar but the limited upside and fairly high expense ratio do not justify taking a position in the PowerShares DB US Dollar Index (UUP). If the dollar does pull back, I may look at something like the ProShares UltraShort Euro (EUO).
How to Profit: For ProShares Ultrashort 20+ Year Treasury (TBT), go 50% long at $62.66 and 50% long at $61.78, with a stop at $59.19 (risk of approx. 4.8%).


