Despite the fact that they are currently overbought, once these market-leading stocks start to correct, they should prove to be attractive new buys, notes MoneyShow’s Tom Aspray.
The Dow Industrials closed May at a new all-time high in May but showed just a 0.8% gain, lagging the 2.1% gain in the S&P 500. Leading the market higher was the Nasdaq Composite, which rose 3.1% after being punished in March and April.
The all-important NYSE Advance/Decline made new weekly and daily closing highs, keeping the major trend positive. Since the 1950s, the S&P has had an equal number of higher and lower closes in June with an average return of 0.1%. In recent years, the best performance was in 2012 as it gained 3.99%, with 2010 the worst as it lost 5.20%.
Over the weekend, in addition to the regular weekly scans I ran my monthly starc band analysis on the 30 stocks in the Dow Industrials. This reveals those Dow stocks that are nearest to their upper starc bands (overbought), as well as those which are closest to their lower starc bands (oversold).
Closeness to the starc+ bands not only indicates that a stock is in a high-risk buy zone but it can also reveal those stocks that are leading the market higher. These stocks can then be watched for good buy levels relative to their monthly support.
For example, at the top of the list is Johnson & Johnson (JNJ), which has gained 12.9% YTD versus 4.79% for the S&P 500-tracking Spyder Trust (SPY). In addition to adding the yields for each of these 10 stocks, I have also highlighted those four stocks that are trending, basis the weekly ADX analysis.
Given last week’s closing yield of 4.74% in the 10-year T-note, the table reveals that seven of these ten Dow stocks have higher yields. The fact that these four stocks are trending suggests they also have significant growth potential, as well as attractive yields. A close technical look at these stocks can allow one to formulate a clear buying strategy.
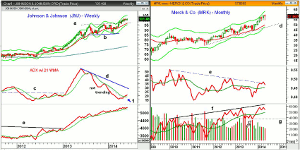
Chart Analysis: Johnson & Johnson (JNJ) broke out of its weekly trading range, lines a and b, on March 21.
- The monthly pivot for June is at $100.40 with the projected pivot resistance at $103.74.
- The weekly trading range has upside targets in the $106-$108 area.
- The breakout level and 20-week EMA are now in the $97 area.
- The April monthly low was $95.39 with the quarterly pivot at $93.45.
- I am using a weekly chart so that I can review the ADX analysis, which has been in the non-trending mode since August 2013.
- The ADX line has now moved above its WMA (point 1) and broken its short-term downtrend.
- The ADX line has stronger resistance at line d.
- The weekly on-balance volume (OBV) staged a major upside breakout in early 2013 as resistance at line e was overcome.
- The OBV has continued to make new highs and has held above its rising WMA.
Merck & Co. (MRK) was down just over 1% for the month but is up 16.5% YTD and has a current yield of 3.01%.
- The 20-month EMA was tested in November 2013 and is still rising strongly.
- The monthly pivot is at $57.37 with the 20-week EMA at $55.20.
- The low of the past three months was $53.57.
- The high in early May was $59.84 with the monthly projected pivot resistance at $62.81.
- The monthly relative performance has just slightly broken its downtrend, line e, from the 2009 high.
- The RS line is well above its now rising WMA while the weekly has risen back to its WMA.
- The monthly OBV shows a pattern of higher highs, line f, and did confirm the recent highs.
- The OBV dropped back to retest its breakout level, line g, in late 2013.
- The weekly ADX (not shown) is at 45 as it completed its bottom formation in late January.
NEXT PAGE: 2 Dow Stocks to Buy on Pullback
|pagebreak|McDonald’s Corp (MCD) was recommended in the April column when it was the sixth most-overbought stock after March and it is up 7.45% of the past three months.
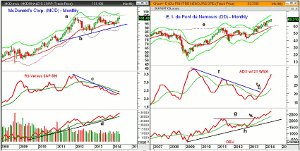
- The monthly chart shows that a flag formation has formed since the January 2012 highs, lines a and b.
- MCD has been testing its 20-month EMA over the past six months and is currently at $94.84.
- The May high was $103.78 but it has not yet closed above $103.70.
- This is needed to complete the flag formation, which has upside targets in the $123-$128 area.
- MCD is currently below its monthly pivot at $101.85 with the projected pivot support at $99.91.
- The 38.2% Fibonacci retracement support from the February low is at $99.05 with the 50% at $97.60.
- The monthly relative performance turned down from its WMA with more important resistance at line c.
- The weekly RS line (not shown) is back below its WMA but does show a completed bottom formation.
- The monthly OBV continues to lead prices higher as it made another new high in May.
E.I. du Pont de Nemours (DD) moved above the 2011-2012 highs in May of 2013 while even longer-term resistance (line e) was surpassed last October. The stock is up just over 8% YTD and has a current yield of 2.60%.
- The monthly projected pivot resistance is at $71.66 with the starc+ band at $75.26.
- The monthly ADX completed a classic move to the trending mode in October 2013 when the downtrend, line f, was broken.
- It had moved above its WMA two months earlier.
- The monthly and weekly relative performance (not shown) are both positive.
- The OBV broke through its resistance, line g, earlier in 2013.
- The OBV made a new high last month and the weekly OBV (not shown) is also strong.
- There is minor support now in the $67-$67.80 area with more important in the $65 area.
What It Means: As I discussed in last Friday’s Week Ahead column, the RS analysis does not currently indicate that the Dow Industrials is a market-leading sector but these overbought Dow stocks have been leading the market higher.
The stock market looks ready for a one-two-day pullback this week, which should be a buying opportunity. Despite the bullish action of the market, it is still not the time to chase stocks and Johnson & Johnson (JNJ) and E.I. du Pont de Nemours (DD) look the best.
How to Profit: For Johnson & Johnson (JNJ), go 50% long at $100.56 and 50% at $99.76, with a stop at $94.93 (risk of approx. 5.2%).
For E.I. du Pont de Nemours (DD), go 50% long at $67.86 and 50% at $67.07, with a stop at $64.73 (risk of approx. 4.1%).
Portfolio Update: For McDonald's Corp (MCD), should be 50% long at $96.64, and I would add 50% at $99.34, with a stop at $95.74.


