The bullish developments after the close in both Facebook and Apple allow for a move in the S&P 500 above 1900, says MoneyShow’s Tom Aspray.
The stock market’s correction was mild, Wednesday, but things really got moving after the close as the earnings from Facebook, Inc. (FB) and Apple, Inc. (AAPL) beat expectations. Both were sharply higher after hours as AAPL also announced a 7-1 split plus a dividend increase.
I was looking for a bit more of a pullback but the positive readings from the NYSE Advance/Decline makes upward acceleration from current levels a possibility. If this occurs, it will make establishing new positions difficult as chasing prices is never a good idea.
There are some lagging sectors that I am watching closely for signs that they are getting ready to join the party. There are still some concerns over the economy as the New Home Sales were very disappointing and some of the homebuilders were hit hard. Today, we get the Durable Goods and the Kansas City Fed Manufacturing Index.
An updated look at the market’s technical studies does allow the S&P 500 to move to or above 1900. A look at key support and resistance levels will help you better define your strategy. Now is not a time to be complacent, so you need to monitor your positions closely and adjust your stops accordingly.
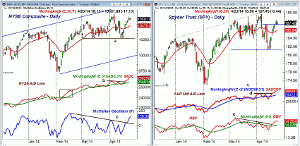
Chart Analysis: The NYSE Composite (NYA) was a bit lower Wednesday, but it is still well above the 20-day EMA at 10,478. The monthly pivot is a bit lower at 10.450.
- Once above the early April high at 10,669 the monthly projected resistance is at 10,728.
- The upper boundary of the trading channel is now at 10,830 with the weekly starc+ band at 10,903.
- The NYSE Advance/Decline is rising sharply similar to what happened in early February (see box).
- The A/D line is well above its rising WMA, and it has moved well above the prior highs, line b.
- The McClellan oscillator has risen sharply over the past five days as it has now clearly broken its downtrend, line c.
- This confirmed that the correction was over, but we could see a pullback to the breakout level.
- On a drop below the 20-day EMA, the monthly projected pivot support is at 10,349.
The Spyder Trust (SPY) was able to clear the resistance at $187.17 with the previous high at $189.70.
- The daily starc+ band is at $190.43 with the monthly projected pivot resistance at $192.40.
- The upside target from the trading range is in the 192.40-$193 area with the weekly starc+ band at $194.05.
- The S&P 500 A/D line has also broken out to new highs as the resistance (line d) was overcome.
- The WMA of the A/D line is rising gradually and it would take another few days of positive action for it to start rising more sharply.
- The daily OBV broke its downtrend, line e, last week and its WMA is now rising.
- The weekly OBV (not shown) is close to making new highs.
- There is minor support at $186.50 with the rising 20-day EMA at $185.54.
- There is more important support at $182.99 and the monthly pivot.
NEXT PAGE: A Winner & Surprising Reversal
|pagebreak|GATX Corp. (GMT) is a $6.40 billion company that rents and leases transportation equipment. It was featured in
3 Transport Picks Ready to Breakout from early January (see arrow).
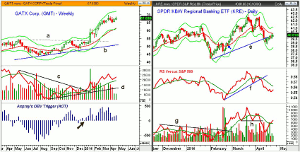
- The weekly chart shows that two weeks later it broke through major resistance at line a.
- This completed the flag formation, lines a and b, and as I noted then would “project a move to the $65-$67 area.”
- GMT hit a high of $69.87 in late March as it came close to the weekly starc+ band.
- The monthly projected pivot resistance is at $71.40 with the weekly starc+ band at $72.25.
- The weekly OBV broke its downtrend, line c, in early January.
- This completed the bottom formation as the uptrend in the OBV indicated accumulation.
- The OBV did confirm the recent highs and is well above its rising WMA.
- The buy signal in the Aspray's OBV Trigger (AOT) supported the bullish case (see arrow).
- The daily technical studies (not shown) show some loss of upside momentum, so I would take some more profits as it is up over 35%.
- There is first good support at $64.66 with the quarterly pivot at $62.76.
The regional banking stocks looked quite good in February and the SPDR S&P Regional Banking (KRE) was one of one of my picks (see arrow).
- KRE hit a high of $42.79 on March 21 as it again tested the daily starc+ band.
- Prices reversed by the end of the day, which started a four-day slide that took prices down to the starc- band.
- The following rebound appeared to be a resumption of the uptrend, but the rally failed in early April at $42.49.
- The decline accelerated as the uptrend, line e, was violated and the starc- band was again reached.
- The relative performance did confirm the March high but the break of the uptrend, line f, signaled a failing rally.
- This coincided with our long positions being stopped out.
- The volume was very heavy in early February as the OBV broke through resistance at line g.
- The OBV did confirm the March highs but then violated support, line h, a couple of days before prices broke support.
- The initial resistance and the quarterly pivot at $40.29 are now being tested.
- The quarterly pivot is at $41.08 with the weekly starc+ band at $43.36.
What It Means: The futures are showing nice gains in early trading but are still 20 points below 1900. Those on the short side are going to get squeezed further early today, and despite the strong positive readings from the technical studies, I would not chase the long side. A setback is inevitable in the next week or so, which should provide better entry levels.
Most of our positions in the regional banks, including the SPDR S&P Regional Banking (KRE), were stopped out; some with small profits and others with small losses as stops had been raised. Nevertheless, the speed of the reversal was a surprise. It is still a group I am watching closely.
How to profit: Now new recommendation
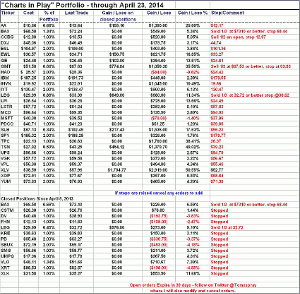
Portfolio Update: For the Spyder Trust (SPY), should be 50% long at $186.08 and 50% at $183.96, with a stop for now at $179.77. Once we get a setback, I will likely tighten it.
For GATX Corp. (GMT), went long from $51.58 and sold 1/3 at $83.23. I would sell another 1/3 at $67.53 or better. Use a stop at 63.83 on the remaining position.
For Capital City Bank Group (CCBG), still 50% long at $12.88 and 50% long at $12.65. Sell 1/2 on the open and use a stop at $12.97 on the remaining position.
NEXT PAGE: The Charts in Play Portfolio
|pagebreak|


