With small-cap and technology stocks pulling back sharply in recent sessions, MoneyShow’s Tom Aspray takes a technical look at sectors that are more likely to outperform in the weeks ahead.
The third day of strong market internals has reversed the deterioration from last week as the NYSE Advance/Decline made a new all-time high on Wednesday. The volume analysis has improved, and it looks as though the market bears will have to deal with higher prices in the weeks ahead.
Though the sharply depressed Nasdaq 100 stocks are likely to rebound sharply, I still think it will take some time before many of them are able to provide good risk/reward entry points. I expect the large-cap averages, which are tracked by the Spyder Trust (SPY) and SPDR Dow Industrials (DIA) are likely to do the best.
The iShares Dow Jones Transportation ETF (IYT) was up 1.68% on Wednesday, and the airlines are one of the top-performing market groups. The railroads also appear to have completed their corrections and it is a group that I am also watching closely.
A review of the market technicals highlight my current outlook, and there are two ETFs that I think can give one broad exposure to US and the global large-cap stocks.
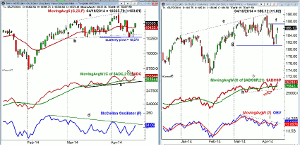
Chart Analysis: The NYSE Composite closed below its trend line support (line b) last Friday but has since rebounded sharply.
- The quarterly pivot at 10,270 was not broken on a weekly closing basis and the market did close above its 20-day EMA Wednesday.
- The next resistance is at last week’s high of 10,555 and then at 10,669, which was the early April high.
- The monthly projected pivot resistance is at 10,728, which corresponds to the upper trend line.
- The NYSE Advance/Decline moved back above its WMA on Tuesday and is now above the early-April high.
- The important A/D support at line c did hold on the recent correction.
- The McClellan oscillator has also reversed sharply to the upside after dropping to two-month lows last week.
- From that low of -149, it has now risen to +34 and a strong move through the downtrend, line d, would be even more bullish.
- There is minor support at 10,432 and the 20-day EMA with further at 10,350.
The Spyder Trust (SPY) closed last Friday at $181.51, which was below the quarterly pivot at $182.99 and was the lowest close since February 10.
- The next resistance is at $187.17 (line e), which was last week’s high.
- The all-time high is at $189.70 with the monthly projected pivot resistance at $192.40.
- The weekly starc+ band is now at $193.03.
- The S&P 500 A/D line did drop below the support at line g (see arrow) before also reversing to the upside.
- The A/D line has now closed above the early-April high and is well above its WMA.
- The daily OBV has also improved as it has moved above its downtrend, line h, and its WMA but is still lagging prices.
- The weekly OBV (not shown) looks ready to close the week back above its WMA.
- There is minor support now at $184.33 and then in the $183.60 area.
- A close below $181.31 would be a sign of weakness.
NEXT PAGE: 2 ETF Picks
|pagebreak|The Vanguard Total World Stock ETF (VT) has a yield of 2.33% with an expense ratio of 0.18%. It has approximately 50% in the US, 40% in international stocks from developed countries, and 10% in emerging markets. In total it has a total of 6071 stocks.
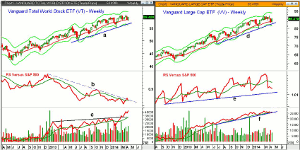
- The chart shows that it dropped below its 20-week EMA with this week’s low at $58.04.
- This was just below the quarterly pivot at $58.32 with further support in the $57 area.
- The relative performance slightly broke its downtrend two weeks ago.
- The RS line needs to move above the last high to complete a bottom.
- The weekly on-balance volume (OBV) broke through strong resistance, line c, in early March.
- The OBV has continued to accelerate to the upside.
- The volume was three times the average on Wednesday.
- There is minor support in the %58.50-$59 area and then stronger at $57.
The Vanguard Large Cap ETF (VV) has a yield at 1.79% with an expense ratio of 0.10%. It has over 80% in mega- and large-cap US stocks. It is up just 1.21% over the past three months. It has a total of 666 stocks.
- The chart looks quite similar to VT as it also dropped below its 20-EMA this week.
- The recent low was $83.29, which was just below the 50% Fibonacci support at $83.36.
- The 61.8% support is at $82.44 with the weekly uptrend (line d) at $82.80.
- The weekly starc- band is at $81.45 with the quarterly pivot support at $81.47.
- The relative performance shows a choppy weekly uptrend, line e.
- The weekly RS line is below its WMA as is the daily.
- The weekly OBV has been testing its WMA and the uptrend (line f) over the past six weeks.
- The daily volume was three times the average on Wednesday.
- The monthly projected pivot support is at $83.64.
What It Means: The new high in the A/D line reinforces the intermediate-term bullish outlook for the stock market. It may take a week or more but this strong action does favor new highs for the S&P 500 and the Dow Industrials.
There are early signs that the large-caps may lead the market higher, so the Vanguard Large-Cap ETF (VV) should do well. I also like the Vanguard Total World Stock ETF (VT) for exposure to the global stock markets. Still long the SPY as recommended on March 31.
How to Profit: For Vanguard Total World Stock ETF (VT), go 50% long at $59.11 and 50% long at $58.54 with a stop at $56.81 (risk of approx. 3.4%).
For Vanguard Large Cap ETF (VV), go 50% long at $85.14 and 50% long at $84.38 with a stop at $81.81 (risk of approx. 3.5%).
Portfolio Update: For the Spyder Trust (SPY), should be 50% long at $186.08 and 50% at $183.96, with a stop now at $179.77.


