Upbeat earnings reports from a few blue-chip stocks reversed the market’s slide from last week, and MoneyShow’s Tom Aspray takes a technical look at four of the top-performing groups in search of opportunities.
For the second day in a row, stocks were able to overcome intra-day selling to close with nice gains. The market internals were positive but not as strong as they were on Monday. The short-term A/D indicators, like the McClellan oscillator, is still rising from last week’s lows but is below zero at -54.
Utilities and the oil service stocks did the best as last week’s new recommendations in the oil sector are acting well. Overnight news on China’s GDP was a bit disappointing but the European markets and US futures are showing nice gains. Today’s close will be important as the Spyder Trust (SPY) is still below the 38.2% retracement resistance at $184.50 with the more important 50% level at $185.49. A daily close above $186.50 would be a positive sign.
With Tuesday’s gains, the SPY is now up 0.33% for the year but is badly lagging the top industry groups YTD. One of my favorite research sites for industry group performance is www.Bigcharts.com. The DJ Aluminum Index (DJUSAL) is at the top of the list, up 20.84%, as the strong performance of an early-2014 favorite Alcoa Aluminum (AA) has certainly helped. But if you click on the Index, you will find that it is just the third best performing aluminum stock in the Index.
A technical look at the top four groups reveals that two of them still look as though they will correct further over the near term.
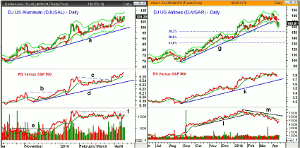
Chart Analysis: The DJ Aluminum Index (DJUSAL) despite its impressive YTD gain has been range bound, so far, this month.
- The 20-day EMA at 105.72 is holding with the daily starc+ band now at 113.56.
- The weekly band is at 114.79 with further weekly resistance from 2011 at 119.
- The daily relative performance broke though its resistance, line b, in late 2013 and led prices.
- The RS line broke through another band of resistance in the latter part of March and has long-term support at line d.
- The daily OBV completed its bottom in December as the resistance at line e was overcome.
- The OBV has recently been in a trading range and a move above the recent highs, line f, would be positive.
- The weekly OBV (not shown) continues to look very strong.
The DJ US Airlines Index (DJUSAR) was the second best performer as it is up 16.39% YTD but is well below the highs made a couple of weeks ago.
- The Index had a high of 185.58 on April 1 and is now down 10.6% from this high.
- The uptrend, line g, was broken last week and the starc- band was tested on the recent decline.
- The 38.2% Fibonacci retracement support from last August’s low is at 151.60, which is just above the weekly starc- band.
- The daily relative performance is holding up better than prices though it is now slightly below its WMA.
- The RS line is still well above its longer-term uptrend, line k.
- The on-balance volume (OBV) looks much weaker as it dropped below its uptrend, line l, in early February.
- The OBV has formed multiple negative divergences, line m, since it peaked in January.
- The weekly OBV (not shown) is now below its WMA but still above the support from the late-2012 lows.
- There is initial resistance now at 172 and the declining 20-day EMA.
NEXT PAGE: 2 More Top-Performing Groups
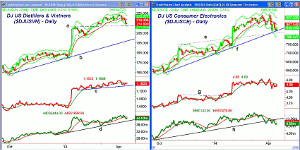
|pagebreak|The DJ US Distillers & Vintners (DJUSVN) is still up 15.87% but has dropped to test support, line a, that goes back to the early-2014 highs, line a.
- The high on April 1 was 224.21, so the Index is currently down 4.3% from its high.
- There is more important support at 202.40, which was the early-February low.
- The daily uptrend that corrects the October and early-2014 lows, line b, is much lower at 197.
- The daily relative performance surged at the start of the year but has spent much of 2014 in a trading range with key support at line c.
- The weekly RS line (not shown) has confirmed the highs and is above its WMA.
- The daily OBV turned up, Tuesday, but is still slightly below its WMA.
- The uptrend in the OBV from the late-2013 low, line d, is clearly intact.
- The weekly OBV is still well above its rising WMA.
- The initial resistance and 20-day EMA are now at 218.65.
The DJ US Consumer Electronics (DJUSCE) as featured in a late-January trading lesson 4 Picks From 3 Top Groups when it was trading near 770. (Editor’s Note: The updating of the data from Tuesday’s close has moved this group to 2nd place).
- The Index hit a high of 925 on April 2, and in less than two weeks, has lost 8.2%.
- It is still up 15.61% YTD and has reached converging support, lines e and f.
- The daily starc- band is at 795 with the major 38.2% support at 727.87.
- The daily relative performance has dropped below its WMA but the weekly has not.
- The daily OBV has broken the support (line h) that goes back to the September lows.
- The daily OBV does not yet show any increase in downside momentum but is below its WMA.
- The weekly OBV (not shown) is now testing its trend line support.
- There is initial resistance now at 867 (20-day EMA) and stronger at 884.
What It Means: The daily technical studies for the DJ US Consumer Electronics (DJUSCE) and DJ US Airlines Index (DJUSAR) indicates that they are still vulnerable to further correction.
The DJ Aluminum Index (DJUSAL) still looks positive technically and one stock in the index, Constellium N.V. (CSTM), is now testing its quarterly pivot at $26.92.
The DJ US Distillers & Vintners (DJUSVN) appears to be just undergoing a normal correction. Constellation Brands Inc. (STZ) is now close to the February lows but the daily studies are still negative.
How to Profit: No new recommendation


