If the US economy continues to grow stronger as the year progresses, the economies in the EuroZone and the Pacific should also improve further. Moneyshow's Tom Aspray updates his analysis of key global ETFs and suggests where those not long could still buy.
The better than expected news on the economy and hopeful jobs numbers pushed the S&P 500 to another record close. Though the Dow Industrials had its highest close of 2014, it is still 0.1% below its all-time high. The analysis of the Dow stocks indicates they are starting to act better and, in the second half of the year, these large-cap, high yield stocks could catch up.
The Stoxx Europe 600 has closed higher for the sixth day in a row, as it has gained 3.7%. The ECB meeting is being watched closely as many are hoping that the low inflation rate will spur another rate cut. Stocks in Asia have also moved higher as the Nikkei 225 hit a three month high on Wednesday. It added another 0.84% in Thursday’s session to close at 15,071. A close above 16,320 will confirm the breaking of its fourteen year downtrend.
In February’s article “Should You Go East or West?” I took a long at both the European and Asian markets. They had rallied sharply from the February lows and I was looking to buy on a pullback. Several of my recommended buy levels were hit on the recent correction, but have these markets really turned the corner? If you are not invested globally, what should you do now?
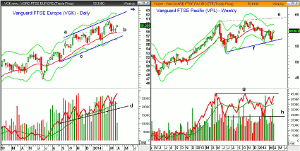
Chart Analysis: The Vanguard FTSE Europe (VGK) is a low-cost way to participate in Europe’s growth. It has over 500 stocks with 20% in the top ten holdings. The United Kingdom makes up 32.9%, with approximately 14% in France and Germany. It has a yield of 3.85% and an expense ratio of 0.12%.
- The weekly chart shows that, after peaking at $60.63, it corrected 4.8% to a low of $56.90.
- The pullback tested the highs from last fall, line b.
- The 20-week EMA was also reached and this is characteristic of a normal pullback.
- The upper boundary of the trading channel, line a, is now at $61.72 with the weekly starc+ band at $62.05.
- The quarterly R1 resistance (see arrow) is now at $63.16.
- The weekly OBV pulled back to its rising WMA but will likely close this week at new highs.
- There is even more important OBV support at line d.
- The 20-day EMA is now at $58.80 with stronger support at $57.61, which is the quarterly pivot.
The Vanguard FTSE Pacific (VPL) has an expense ratio of 0.12% with 812 stocks. In addition to 56.4% of its holdings in Japan, it has 19.3% in Australia, 11.3% in Korea, 8.9% in Hong Kong, and 3.7% in Singapore. It has a yield of 2.55%.
- The weekly chart shows what appears to be a long-term flag formation.
- There is next resistance at $61.20 from the start of the year with the weekly starc+ band at $61.82.
- There is additional resistance at $62.19, which was the October 2013 high.
- On a breakout above the resistance at line e, the chart formation projects a move to the $72-$74 area.
- The weekly OBV shows a broad trading range, lines g and h.
- The OBV tested its rising WMA just over two weeks ago and shows a pattern of higher highs.
- The bullish readings from the monthly OBV do suggest that this is a pause in the uptrend, not a top.
- The daily OBV (not shown) has broken its downtrend from last September’s, so all three OBV measures are positive.
- The 20-day EMA and quarterly pivot are in the $58.53 area.
NEXT PAGE: 2 More Global ETFs to Watch
|pagebreak|The WisdomTree Japan Hedged Equity (DXJ) has 312 stocks and hedges its yen exposure. The ETF has approximately 17% in the consumer cyclical, industrials, and technology. It yields 1.28% and has $11.8 billion in total assets.
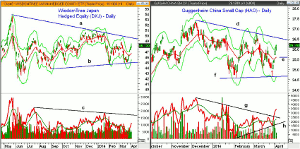
- In early February, DXJ had a low of $44.66 but held above these lows in March as it dropped to $44.90, line b.
- The daily starc+ band is now being tested with the daily downtrend at $49.62.
- The quarterly projected resistance is at $50.31 with the weekly starc+ band at $50.69
- A completion of the flag formation, or continuation pattern, has upside targets at $55-$57.
- The 128.2% Fibonacci target is at $57.25.
- The daily on-balance volume (OBV) has moved well above its WMA and broken its short term downtrend.
- There is further OBV resistance at line c, and the weekly OBV (not shown) also looks strong.
- There is short-term support now at the gap in the $46.46-$46.91 area with the quarterly pivot at $47.00.
- This includes the rising 20-day EMA at $46.72.
The Guggenheim China Small Cap (HAO) has total assets of $236 million with an average volume of 130k, which is a bit thin. It has approximately 270 stocks with an expense ratio of 0.75% and tracks the AlphaShares China Small-Cap Index.
- The daily chart shows that HAO dropped to a low of $24.68 on March 27, which was just above the February low of $24.59.
- The close Wednesday was at the daily starc+ band with the downtrend, line d, at $26.56.
- The early March high was $26.72 with a December high of $26.83.
- An upside breakout from the continuation pattern, lines d and f, has upside targets in the $28.50-$29.50 area.
- The daily OBV surged through its downtrend, line g, this week.
- The OBV has support now at the uptrend, line h.
- The weekly OBV (not shown) is very close to moving back above its WMA.
- The 20-week EMA is at $25.75 with the quarterly pivot (line e) at $25.60.
What it Means: It continues to be my view that the US economy will get even stronger as the year progresses and this is also true of the EuroZone. This should be beneficial for the Asian markets, including China.
The recent strength in the emerging markets is an encouraging sign and the depth of the next pullback will be important. Those not long, as previously recommended, should look for a pullback to the 20-day EMA to buy.. Aggressive investors could look to buy Guggenheim China Small Cap (HAO) on a pullback, but be sure to use limit orders.
How to Profit: For the Guggenheim China Small Cap (HAO) go 50% long at $25.76 and 50% at $25.38, with stop at $24.42 (risk of approx. 4.5%).
Portfolio Update: For the Vanguard FTSE Europe (VGK) should be 50% long at $58.16 and 50% at $57.28, use a stop now at $56.67.
For the Vanguard FTSE Pacific (VPL) should be 50% long at $57.36 and 50% long at $56.44. Use a stop at $56.18.
For WisdomTree Japan Hedged Equity (DXJ) should be 50% long at $45.06. The recent low was $44.90, so the second buy level at $44.34 was not hit. Use a stop at $44.74.
The order for Wisdom Tree Europe Small-Cap Dividend (DFE) was not filled, but may issue a new recommendation.


