Although last week’s panic selling has relieved some of the market’s overbought conditions, MoneyShow’s Tom Aspray counsels patience before buying at the current levels.
The action over the past week has certainly caused many of the prominent market bears to run for cover and Tuesday’s action added to their pain. Better-than-expected trade data overnight from China has pushed the European markets even higher in early trading on Wednesday.
Some of the bears have already thrown in the towel, but as I mentioned in January in Souring Sentiment Will Help Stocks, a higher level of bearishness is good for stocks. There has been broad improvement in the technical outlook, which indicates that the market is likely to move to new highs this quarter. The evidence comes from a wide range of indicators including another reversal in the Volatility Index (VIX), which was also seen at the October and June lows.
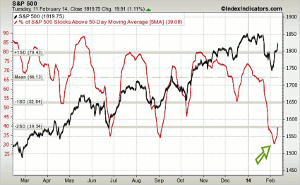
With over 70% of the S&P 500 stocks above their 50-day MAs at the end of 2013, the market was in the high-risk buying zone. This has changed dramatically over the past six weeks as the five-day MA dropped below 35 last week and has now turned higher. The recent low was below the lows seen in June and October.
Last week’s panic selling was more severe than I was expecting but the spike in bearish sentiment, I thought, was a positive for investors. When the market is under the influence of either panic selling or a buying stampede, it is the worst time to react emotionally.
The current market environment does not favor chasing prices or aggressive buying at current levels in the market averages. A review of the key market averages and indicators illustrates why a patient buying approach should be best.
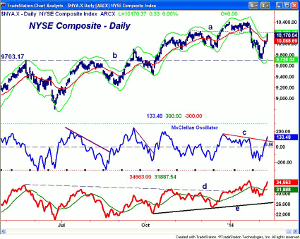
Chart Analysis: The daily chart of the NYSE Composite shows that it closed at the daily starc+ band and back above the quarterly pivot at 10,082.
- There is next resistance at 10,227 (line a) and then the monthly projected pivot resistance at 10,276.
- Once above the late-2013 high of 10,406, the weekly starc+ band is at 10,549.
- There is initial support now at 10,040-10,068, which corresponds to the 20-week and 20-day EMAs.
- There is an additional band of support in the 9900-9975 area.
- The McClellan oscillator did not get to extreme oversold levels on the market decline as it had a low of -178.
- The oscillator closed last week above the zero line and has now broken its downtrend, line c.
- The Arms Index or TRIN did reach oversold extremes as it closed at 3.42 on Monday, February 3.
- The longer-term chart of the NYSE Advance/Decline shows that it broke through resistance at line d in January.
- This, and the new high in the weekly NYSE A/D line, were key reasons why I thought a correction would be well supported.
- The A/D line did hold above support (line e) and is now close to making new highs as it is stronger than prices.
NEXT PAGE: Two Best ETFs to Buy
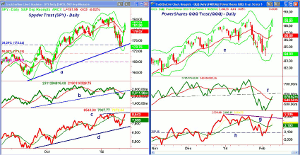
|pagebreak|The Spyder Trust (SPY) dropped below the 38.2% Fibonacci retracement support at $174.44 as the low last week was $173.71.
- On Tuesday, the daily starc+ band was tested with further resistance at $182.50 to $183.12, which is the monthly projected pivot resistance.
- The 20-day EMA at $179.62 represents first support with further in the $177.50 to $178.50 area.
- The daily OBV broke its uptrend, line b, on the decline and has just moved back above its WMA.
- It is acting weaker than prices as it is still well below the resistance from November and January.
- The weekly OBV (not shown) has moved back above its WMA.
- The S&P 500 A/D line did make new highs in January, which confirmed the price action.
- The A/D line is rising sharply and is close to the prior highs, line c.
The daily chart of the PowerShares QQQ Trust (QQQ) shows the dramatic reversal from last Wednesday’s doji low.
- The QQQ is already up over 6% from the doji lows and an HCD was triggered on Thursday.
- The close Tuesday was at the daily starc+ band and also very close to the prior highs.
- The monthly projected resistance is at $90.92 with the weekly starc+ band at $91.72.
- There is initial support now at $87.50 with the 20-day EMA at $86.68.
- There is further support in the $85.50 area and then last Wednesday’s low of $83.74.
- The daily OBV has just moved back above its WMA and is still below the resistance at line f.
- The weekly OBV (not shown) has turned up from its rising WMA.
- The Nasdaq 100 A/D line has been very strong since it tested the support at line h.
- The break through the resistance at line g confirms that the correction is over.
- The A/D line could drop back to its WMA on a pullback.
What It Means: There were plenty of stocks that have moved impressively higher in the past few days with technology, healthcare, and utilities showing the best relative performance. The biotech sector was also very strong on Wednesday. The ability of the SPY and QQQ to hold above their quarterly pivots on the correction was a positive sign.
Both the SPDR Dow Industrials (DIA) and iShares Russell 2000 (IWM) are currently lagging, and I would avoid them for now.
There should be a meaningful pullback in the next week or so that will create a better risk-buying opportunity in the market-tracking ETFs. Therefore, a patient approach is recommended, but it will require that you have resting orders in the market. Positions in both Europe and Japan will also be favored on a pullback.
How to Profit: For the Spyder Trust (SPY), go 50% long at $178.34 and 50% at $176.56, with a stop at $171.57 (risk of approx. 3.3%).
For the PowerShares QQQ Trust (QQQ), go 50% long at $87.24 and 50% at $86.32, with a stop at $82.18 (risk of approx. 5.3%).
Editor’s Note: If you’d like to learn more about technical analysis, attend Tom Aspray’s workshop at The Trader’s Expo New York, February 16-18, 2014. You can sign up here, it’s free.


