While many traders focus on the short-term swings, others like Moneyshow’s Tom Aspray look at the year-to-year changes, as well as the yearly opening ranges to help him guide his long-term outlook.
Stocks started off the week on a mixed note as the selling in the tech sector, especially Apple. Inc. (AAPL) and Goggle, Inc. (GOOG) hit the Nasdaq 100 hard. Is the tech sector sending a warning to the whole market? Or will the earnings from the financial sector be enough to push the S&P 500 above 1473 and signal a test of the 1500 level.
The futures are down in early trading as they may be reacting to comments from Washington that the debt ceiling fight is heating up. Some investors and traders are examining the yearly closes, as well as the 2013 opening ranges in the key markets to help them develop a plan for 2013.
Chart Analysis: To get a clear outlook for the stock market I look at the year-to-year closes in most of the major stock market averages. In 2011, I took a look at the yearly chart of the Dow Industrials which revealed nine consecutive higher closed from 1991 to 2000.
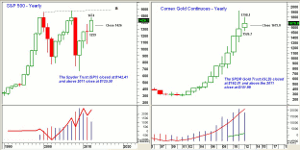
- The yearly chart of the S&P 500 (SPY) shows that it closed sharply higher in 2012 at 1426.
- In 2011, the yearly close was flat forming a doji, but it did make higher high for the year.
- For 2013, the S&P 500 opening at 1426 and the 2012 high at 1474 are both levels to watch.
- The major resistance (line a) connects the 2000 and 2007 highs and is currently at 1581.
- The yearly on-balance volume (OBV) shows a positive pattern of higher highs and higher lows.
- Clearly the 2011 close at 1257.60 and the low for 2012 at 1258.86 represents a key level of support.
- For the S&P E-mini futures, the 2012 close was at 1423.75 with the open at 1443.
- For the Dow Industrials, the 2012 close at 13,104 and last year’s low at 12,035 are the key levels.
- The year-end rally in the Dow Jones Transportation Average pushed it to a higher yearly close, but the yearly range was tight with support at 4795.40.
- After a huge range in 2011, the small-cap Russell 2000 closed strong in 2012 and has already exceeded last year’s high at 868.50.
The Comex gold futures 2012 close at $1675.80 was well above the 2011 close at $1566.80. The long-term chart shows that this was the eleventh consecutive higher yearly close.
- For 2013, the yearly range of $1798.10 and $1526.70 are the levels to watch.
- The yearly OBV like the monthly OBV has confirmed each new high since 2002.
- The SPDR Gold Trust (GLD) closed at $162.01 with the 2012 high at $174.07 and a low of $148.53.
- The quarterly pivot for GLD is at $165.21 with the S1 support at $156.35.
- Comex silver, basis the continuous contract, closed 2012 at $30.22, which was above the 2011 close of $27.91.
- The 2011 low at $26.04 and the 2012 low at $26.07 are now the key levels of support.
NEXT PAGE: Yearly Ranges in FX & Oil |pagebreak|
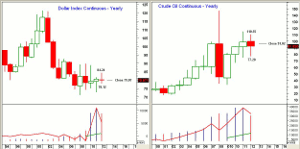
The Dollar Index closed at 79.87, which was just below the 2011 close of 80.52. The yearly chart shows that a doji was formed, which is a sign of indecision.
- The 2012 high at 84.24 and the 2011 low at 72.86 now appear to be the critical levels.
- The euro/USD rate closed at 1.31.93, which was a bit above the 2011 close of 1.2959. The 2012 low at 1.2012 now appears to be an important level of support.
- The dollar closed 2012 higher versus the yen at 86.70. This was the first higher dollar close since 2009.
- Traders who were watching the 2011 dollar low at 75.54 may have spotted the 2012 low at 76.02 as in terms of risk it was a great buy level.
Crude oil did close the year lower at $91.82, which was significantly below the 2011 close of $98.83.
- This suggests that the rally in crude oil from the 2009 low of $33.20 may be stalling.
- There is yearly resistance now at $110.55 with the 2011 high at $114.83.
- The March crude oil contract has quarterly pivot support at $91.43 and R1 resistance at $97.07.
- For yearly support, one should watch the 2012 low at $77.28 and then the 2011 low of $74.85 as a break of both levels would be significant.
- The yearly OBV still shows a strong uptrend as it made significantly higher highs in 2011.
What it Means: As I pointed out in the earlier article, these yearly closes as well as the yearly ranges can often provide one with a different perspective on some of the key markets. I pointed out that the S&P 500 closed 2007 at 1,468.36, and the year’s low was 1,363.98. The break of this low in January 2008 was a good bear market signal for the next year.
Therefore, you may want to write down some of the key levels for the markets you are interested in and tape them to your desk or monitor as sometime in 2013, they may be quite important.
How to Profit: No recommendation


