For the benefit of traders in the realm of forex, Adam Lemon, of DailyForex.com, lays out some of the most reliable ways to define a trend and takes a technical look at seven currency pairs to determine if there are currently any trends left to trade.
One of the easiest and most reliable ways to make money trading forex is to follow trends and let winning trades run for as long as they will run. When you trade like this, most of your trades are small losing trades, but sooner or later they are more than paid for by a few huge winners. It takes some discipline to trade like this, but it is pretty easy. You don’t need to be a genius or even very experienced or knowledgeable to trade profitably in this style.
What you do need, of course, is at least one trend to exploit. When the forex market is very flat and trends are completely absent, trend traders cannot avoid losing money if they want to participate, so identifying trends becomes really vital.
So, what are the best ways to define a trend that you want to trade?
How to Define a Good Forex Trend
Think of individual currencies, and how that currency is performing against other currencies. A good trend in one currency pair should also be visible in other pairs involving that currency. For example, if you see what you think is a good upwards trend in the EUR/USD currency pair, you should also see a similar trend with the euro being strong against some other currencies and the US dollar being weak against some other currencies.
The best trending currencies over the last 15 years have been the US dollar, followed by the euro. The smaller currencies tend to trend in a less stable way. A trend should show steady, stable directional movement over a period of time, not wild gyrations up and down.
A good starting point is to look at the USD against the other seven major currencies. Look at a weekly chart of each of those seven pairs. Put a few indicators on the chart: the 10 period RSI (Relative Strength Index), the 3 period EMA (Exponential Moving Average), and the 10 period SMA (Simple Moving Average). All of these indicators should be set to closing prices.
Now look at each chart and ask the following questions:
- What is the value of the RSI? Which of the seven currency pairs have the highest/lowest values?
- Is the price higher or lower than it was three months ago?
- Has the pair very recently made new high or low prices for the last three months?
- Are the two moving averages both angled smoothly and steadily up or down or are they twisted together?
Let’s apply these tests to each of the aforementioned currency pairs and see if we have any good forex trends.
NEXT PAGE: Are There Any Good Trends Left?
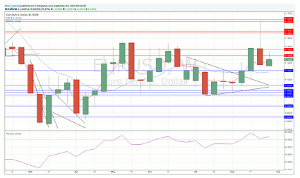
|pagebreak|The price is about the same as it was three months ago. The RSI is very close to its median 50 level. The moving averages are now pointing upwards but have been choppy over the past several weeks. There is no good trend here, in fact, this is an excellent example of a ranging currency pair.
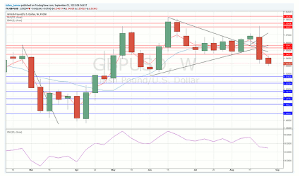
This looks like a pair that might just be beginning a downwards trend. The price is below where it was three months ago and the last week has bent the moving averages into a downwards trend shape. Most importantly, the price has just been making—and is very close to—new 3-month lows. The RSI is 44. Here we see a stronger USD and a weaker GBP and a possible pair to trade short.
This is the same situation as the EUR/USD pair, with no good trend in place, just ranging action now.
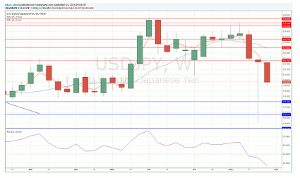
This is a strange chart, but still it looks like a downwards trend might have begun. However, the excessively large and bullish pin bar that was made last week does look like a cause for concern, indicating possible instability: not an orderly descent. Nevertheless, the RSI is quite negative at 37.29 and the price made strong 3-month lows just last week. This suggests a strong JPY and weakening USD.
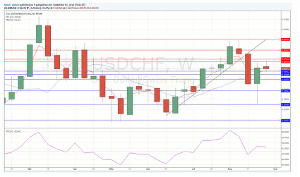
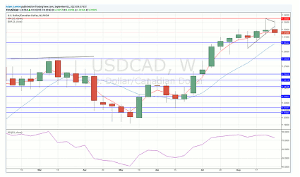
Finally, we see a clear upwards trend that meets all of our criteria.
The price has been rising for several weeks and made a new 3-month high price just last week. The moving averages are quite smoothly extended upwards in good order. The RSI is very high and bullish at 73.86. The trend might be mature, but you should never see an established trend and assume it will end just because it has been going on for a long time.
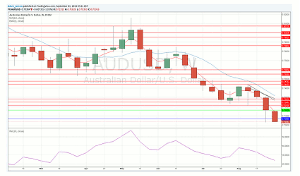
This is a nice, clear and stable downwards trend that has been going for 16 weeks. As I write, the pair just made a new 3-month low, in fact, it also made new 3-month lows last week. The moving averages are smoothly moving down and the RSI is at a very low 23.67. This is an excellent trend.
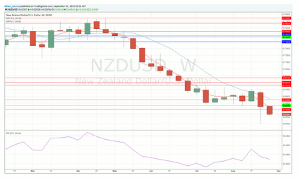
A very similar picture to AUD/USD. This is a nice, clear and stable downwards trend that has also been going for 16 weeks. The pair made a new 3-month low last week. The moving averages are smoothly moving down and the RSI is at a very low 24.83. This is an excellent trend.
Conclusion
These charts have shown that although the USD seems strong overall, it has shown weakness and a possible downwards trend against the JPY. This is a little worrying, as the best trends occur when the USD is showing either strength or weakness against all the other major currencies.
There is no doubt that the weakest currencies and healthiest trends lie in shorting the AUD, and to a slightly lesser extent the NZD. There is also the trend of a weak Canadian dollar.
A logical approach might be to trade with half of total risk divided equally short AUD/USD and NZD/USD, with the remaining half going to long USD/CAD.
These trends look fairly healthy but they will be much healthier still if and when the USD gets a more confirmed bullishness, including against the JPY.
There are still some good trends left: short AUD/USD and NZD/USD, long USD/CAD.
By Adam Lemon, Contributor, DailyForex.com

