The staff at Admiral Markets takes a technical look at the price action of three major currency pairs marked by wedge patterns and highlights the areas to watch depending on whether they break or bounce next.
Currency Pair EUR/USD
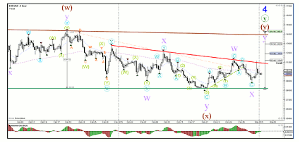
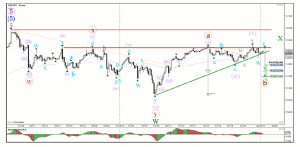
The EUR/USD completed the wave C (blue) near the previous bottom (green) and made a rally up to the resistance trend line (red). A break above it would signal the continuation of wave 4 (blue) whereas a break below support could indicate the completion of wave 4.
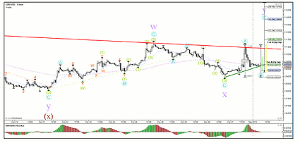
The EUR/USD showed strong price action, which could be explained as a wave A (blue) of a bigger ABC.
Currency Pair GBP/USD
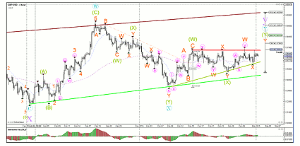
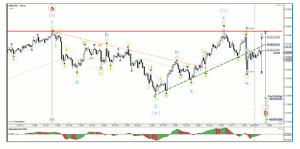
The GBP/USD price action remains relatively choppy with the resistance (red) and support (green) wedge trend lines narrowing in.
Price action (magenta) broke above the inner resistance trend line (dotted orange), which could be an impulsive A (magenta) followed by a wave B retracement.
Currency Pair USD/JPY
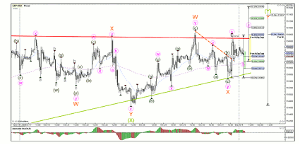
The USD/JPY price action is being squeezed in between support and resistance. A bearish breakout confirms the continuation of wave Y (blue) whereas a bullish break would indicate a change of the wave count.
The USD/JPY bearish price action broke the support trend line (dotted green) with an ABC zigzag, which could be part of a larger WXY (blue) correction.
By the staff of Admiral Markets

