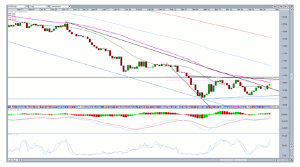
OANDA market analyst Craig Erlam takes a technical look at how the euro continued to rally against the USD on Friday before running into trouble around the 50-day SMA, which, he thinks, was always going to be a tough obstacle to face, given several past failed attempts to break through.
The euro continued to rally against the dollar Friday morning after breaking above the descending Thursday, taking out last Friday, April 17’s highs early in the session before running into some trouble around the 50-day simple moving average.
This was always going to be a tough obstacle, with the pair having traded below here for almost a year and failed in its attempts to break through on a couple of occasions.
The fact that it fell on a round number—1.09—was never going to help either as these levels tend to carry some psychological significance. Especially if we’ve seen support and resistance around them previously, which we have on numerous occasions.
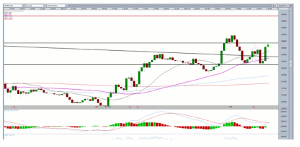
That said, I’m not convinced we’ve seen the last assault on the 50-day SMA. As you can see on the 30-minute chart below, the correction off the failed break has led to the formation of a possible double bottom.
Of course, the neckline will need to be broken before it is completed, but if that happens, it would suggest—based on the size of the formation—that we could see a move to 109.50, a significant break of the 50-day SMA.
If this does occur, it could open up a move back towards the top of the range and would mean both conditions have been met that would make me brace for a greater correction to the upside. The only thing left now is for the EUR/USD to break above the month-long trading range, through 1.1050.
*The above information can be found in Forex Labs section of the Web site.
By Craig Erlam,Market Analyst, OANDA


