Walker England of DailyFX.com explains the premise of using this oscillator when trading currencies.
The Commodity Channel Index (CCI) is an oscillator introduced in the 1980s and used by many traders to pinpoint market entries. Even though its name refers to commodities, CCI can also be used to trade currencies and other markets.
Traditionally CCI can be used in a variety of conditions, including breakouts, ranges, and trends. Today, we will primarily look at using CCI to trade trend retracements with overbought and oversold levels. So let's begin learning about CCI.
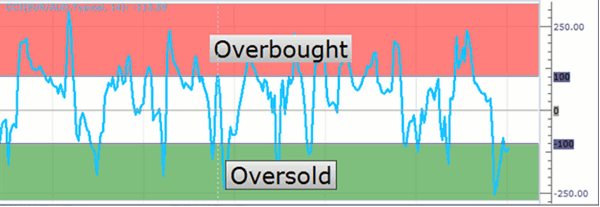
CCI is very similar to other oscillators, such as RSI, in that it depicts overbought and oversold levels for traders. Pictured above, we can see that above the +100 value is considered overbought, while below the -100 value is considered oversold. Normally 70% to 80% of the values tend to fall between overbought and oversold levels.
As with other overbought-oversold indicators, this means that there is a large probability that the price will correct to more representative levels. Knowing this, retracement traders will wait for the indicator to stretch outside of these levels and initiate new positions from the cross back inside the range. Let's look at an example using the NZD/USD.
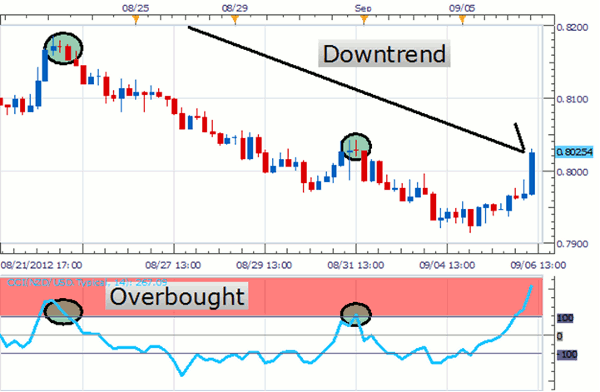
Above we can see an example using a four-hour graph of the NZD/USD currency pair. As prices decline with an established downtrend in place, traders will anticipate taking new sell positions.
The primary way of timing entries with CCI in a downtrend is to wait for the indicator to move above the +100 (overbought) and cross back below +100. This creates an opportunity to sell the currency as momentum is returning back in the direction of the trend.
Place your stop-loss just below the swing high. Look to take profits at least twice the distance to your stop-loss so you are maintaining at least a 1:2 risk-reward ratio.
Walker England is a trading instructor at DailyFX.com.


