By observing what the Sector Rotation model is suggesting about where we are in the cycle, technician Corey Rosenbloom, of AfraidToTrade.com, explains how he is also able to highlight which sectors demand attention moving forward and which ones should be avoided.
As we transition from April into May, let’s examine what the Sector Rotation model suggests about where we are in the cycle by comparing relative strength and weakness.
A second bonus of Sector Rotation is to highlight sectors that call our attention and others that probably should be avoided.
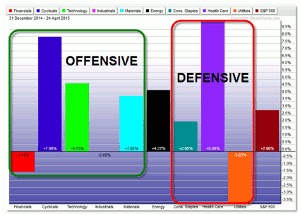
Let’s start with our Sector Strength/Weakness Grid so far in 2015:
If you’re new to the model, we group the nine major sectors using the AMEX Sector SPDRs (EFFs) into two categories:
- Offensive Sectors tend to do well during bull markets when there is a Risk-On Environment
- Defensive Sectors do best during bear markets or Risk-Off Capital Protection Environments
We can judge the health or weakness of the stock market by looking at which group is stronger at the moment.
Right now, we’re seeing mixed signals because the defensive Health Care (XLF) Sector is the strongest performer at 9.00% up this year but we’re also seeing Consumer Cyclicals/Discretionary (Retail) group up 8.00%.
The worst performing sector is the defensive Utilities but this is countered by a weak performance in Financials.
In addition to the two strongest sectors straddling both groups, we’ve seeing mixed performance within these groups.
In general, the Offensive Sector is stronger with Discretionary, Technology, and Materials outperforming the S&P 500’s 2.06% performance year-to-date.
Before we get too bullish, realize that Financials and Industrials are weak so far in 2015.
In 2015, we’ve seen a general consolidation or slightly bullish rising market that has experienced two sideways rectangle patterns.
Perhaps unsurprisingly, the Sector Strength model is also mixed with a slight bullish indication.
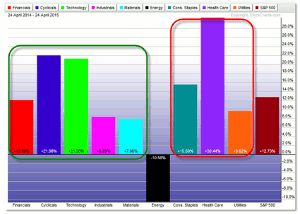
Let’s raise the perspective to compare the performance over the last full year:
Let’s start with the S&P 500 which increased almost 13% from this date on April 24, 2014.
Four sectors outperformed the S&P 500 during this time…two Offensive names and two Defensive names.
Offensive groups: Cyclicals/Discretionary and Technology almost doubled the performance of the S&P 500…but so did defensive Health Care.
Energy—with the collapse of oil—is down 10.60% over this period.
All other sectors were close to the S&P 500 performance, though Industrials, Materials, and Utilities lagged.
So, what does this say about the health/weakness of the market?
I wish the picture was clearer but we listen to the market’s message without bias.
There’s still a bullish slant to money flow and thus the uptrend of the market but it’s not incredibly strong.
The fact that Consumer Discretionary and Technology (sectors) are strong does suggest additional upside to the market but not unbridled bullishness, as Health Care and Staples are also among the top gainers in the cycle.
I’m reading a cautious bullish signal from the current sector performance model, which is in line with what the broader picture and trend of the market…up but cautiously higher.
By Corey Rosenbloom, CMT, Trader and Blogger, AfraidToTrade.com


