Technician Greg Harmon of Dragonfly Capital investigates where the money has flowed after the recent wicked pullback in small-cap and tech stocks.
By now we all know that the mainstream media looks for the most headline-grabbing story and then pumps it up some more. So, if you have been following the financial markets this way, then you are likely to be scared out of your pants every day.
The most scandalous moves of recent days have been in the small-cap and technology names. So, with them pulling back, that is what you hear about. It is true that they are pulling back but is it a crisis? There has already been a lot of discussion about these indexes being only 9% or 10% off of their high. They may continue lower but they may also stop and reverse. Either way, if you are in a full red-faced panic now, what will you be like if they do fall another 10%?
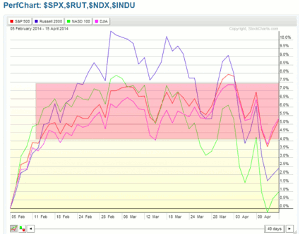
But what if you looked at the recent activity in a little bit of a different way like above. The chart shows the performance of the four major indexes, Dow Industrials, S&P 500, Russell 2000, and Nasdaq 100, since the February 5th low and reversal. What does it tell?
On the move off of that low all indexes had an immediate 4% bounce before the small-cap and tech stocks started to outperform. The small-caps were then on fire reaching a 10.5% move higher before pulling back. They have gone on to retrace about 85% of the move up from that February low.
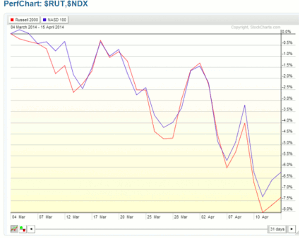
The Nasdaq outperformed also but those stocks started to fade back to the pack sooner, and then continued lower retracing the entire move plus a little more. The range between 4% and 7.5% has held the Dow and S&P since the week following the bounce. Sideways motion. Now pull out those under-performing indexes and take a look at them since the March 4th peak. Have they been a little bit correlated?
What does this all mean? As money has been flowing out of the small-caps and technology names, it has not been going into the large-cap names. But importantly, it has not been moving out of the large-cap names. Let me repeat that. Money is not moving out of the large-cap names. Where has the money from the small-caps and tech names been going?
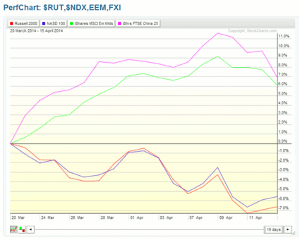
Well here is one possibility. Adding the emerging market and Chinese ETFs as above shows a distinctly negative correlation that began about two weeks after money started moving out of the small-caps and tech names. Certainly some money was flowing here. The shift in risky assets from domestic to foreign holdings. Now that the foreign markets are starting to retrace, will the money flow back into the domestic market? Keep a tight watch on this.
By Greg Harmon of Dragonfly Capital


