The staff at Stock Barometer discusses the market’s potential 1-month return based on the action of the barometer last Friday and what it could mean for future covered call and put options trades.
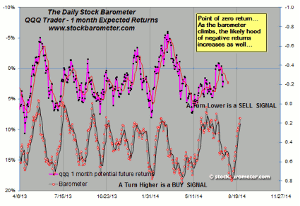
Here's a chart that shows the market's potential 1-month return based on the action of the barometer.
The line on the bottom is the barometer. The line on top is the 1-month future return of the (QQQs). As you can see, the right side of the return line is not filled out yet—that's because this is a forward looking indicator, so we do not know what the return 30 days from today will be...but we can look back and use this as a basis to see what similar points in time have returned in the past. So, for example, if you look back at the first peak in the barometer from 2013, you can see that when the barometer turned lower, the market's future return was around -5%.
And when the barometer bottomed after that point, the market returned +5-7%.
So, based on this data, we can make the following observation. Given the level of the barometer last Friday, the market's likely future return is less than zero to -5% over the next month. We do look over longer periods, but 1 month is a good focus point, since most trades should last longer than a month.
What you can also observe from this indicator is that during a bull market, the negative returns will be muted. You can look at the period from July 2013 to the beginning of 2014 and for the most part, you could have bought the QQQs at any time during that period and closed your trade in one month with a positive return.
The market is turning lower last Friday morning and we're close to a window where we would start issuing our covered call and put options trades. So stay tuned...
By the Staff at Stock Barometer


