Using the criteria of Sir John Templeton, MoneyShow's Tom Aspray takes a technical look at past and present bull markets to see if one could argue we're currently finishing a phase that will allow for future gains as the market matures.
With more new highs in the major US averages last week, some analysts are worried about too much complacency, and therefore, the potential for a market top. Others argue that the increasingly strong US dollar and very low crude oil prices will cause a sharp increase in positive consumer sentiment that will finally encourage the public to buy stocks.
On the other hand, some are already warning about the economic threat of lower crude oil prices and arguing it might be a negative for the stock market as we head into 2015. Of course, some of the same folks thought a few years ago that the high deficit was a reason that the stock market could not go higher. The very weak performance this year of many macro hedge funds illustrates the difficulty in investing based on a long-term economic view.
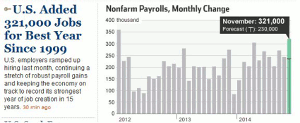
Of course, the market was startled last Friday by the very strong monthly jobs report as the home page from the Wall Street Journal illustrates, this may be the strongest year of job growth since 1999.
Though, for most, this would appear to be a positive development for the economy and stock market, the financial media does not seem so sure. In my view, it takes a jaundiced eye to read anything negative into the strong job growth. This is probably just another example of why investors should pay little-if any-attention to the financial media.
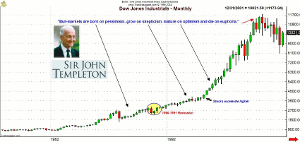
Long-term readers of my column should know that I do not make long-term forecasts as-at best-my crystal ball only goes out 6-12 months. As I was attempting to reduce the mountain of financial paper I have accumulated for years, I came across this quote from Sir John Templeton, "Bull-markets are born on pessimism, grow on skepticism, mature on optimism, and die on euphoria."
Sir John was a speaker at several MoneyShow financial conferences and is known as a pioneer in the use of globally diversified mutual funds. This link will take you to more of his quotes.
I have taken a look at the 1982-2000 bull market in the Dow Industrials and have identified the four periods that I feel meet Sir John Templeton's criteria.
From 1982, through the recession in 1990-1991, I think was a bull market that was fueled by pessimism after the previous period of high inflation. The crash of 1987 scared many investors and likely kept them out of stocks for a number of years.
During the 1990-1991 recession, the Conference Board's Consumer Confidence plunge below 50 reflected the very negative outlook for the economy. There was quite a bit of skepticism when Bill Clinton was elected President and the Democrats took over. Of course, the Republicans took back the house in the mid-term elections and the government shutdown did not reassure investors. Also, the devaluation of the Mexican peso in 1994 had a ripple effect on the global markets.
The economy continued to gain strength in 1995 as did the Dow Industrials as it started to accelerate to the upside. This, I think, was start of the maturation phase of the bull market that led eventually to the dot.com euphoria in 2000 and the major market top.
Following this scenario, I think one can argue that we are finishing the "grow on skepticism" phase which allows for considerable gains down the road as the market matures.
I have no idea how far stocks can go or how long it might last but feel confident that my technical analysis of the market, and of the economic data, will give me plenty of warning before a major top is formed.
I continue to expect both the US and global economies to improve in 2015, unless the ECB gets really stupid. China should also do better as weakness in the Chinese economy kept many out of the US market in 2014. They took the view the US economy could not possibly get stronger without China.
This has turned out not to be the case. The surprising rate cut in China illustrates that their economy is still fragile and will need more time before it could be considered healthy.
NEXT PAGE: What to Watch
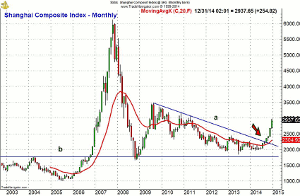
|pagebreak|Now some in the financial media are concerned because the Shanghai Composite has risen too far, too fast. It is up 28% from the late October lows and the monthly chart shows that, despite the multi-year decline, it was able to hold above the 2008 lows, line b.
Its gradual decline also was able to hold above the highs from 2004 as the former strong resistance is now important support. The long-term downtrend, line a, that was broken in September, now finally appears to have completed a long-term bottom.
The manufacturing data last week was generally better than expected as the ISM and PMI Manufacturing Indexes both came in a bit better than expected. That was also the case for Construction Spending.
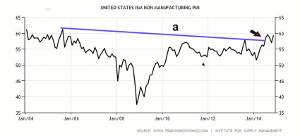
The ISM Non-Manufacturing Index surged to 59.3 in November, up from 57.1 in October. The downtrend, line a, had been broken in early 2014 and the recent setback appears to be a retest of the breakout. Factory Orders last Friday were a bit weaker than expected, which was likely do to lower crude oil prices.
This week's calendar is light with Retail sales on Thursday along with the jobless claims. In Friday's column, Navigating a Tough Retail Market, I shared some ideas on ways to participate on continued strength in the retail sector. On Friday we get the PPI and the preliminary reading on Consumer Sentiment from the University of Michigan.
What to Watch
Two weeks ago in What Are Global Bankers Afraid Of? I expressed a more cautious outlook as I suggested that those who had double digit gains from the start of the year should consider taking some profits or establishing light hedges.
That is still not a bad idea, though the weekly technical outlook has improved past two weeks. The market averages must still be considered high risk as they are well above good support. However, there are some sectors and industry groups that look interesting.
Several of the small-cap stocks I recommended in 4 Small-Caps with Bullish Monthly Volume have turned higher after reaching their buying zones. The small-cap indices are starting to gain relative strength and I recommended the iShares Russell 2000 Index (IWM) last week.
The brokerage stocks Raymond James (RJF) and Charles Schwab Corp. (SCHW) hat I recommended last month in Will It Be an Early Christmas for the Brokers? have also broken out to the upside.
The bullish sentiment, according to AAII, dropped almost 10 points last week from 52.15% to 42.68%. The number of bears also increased to 25.94% after hitting a low of 15.05% at the start of November.
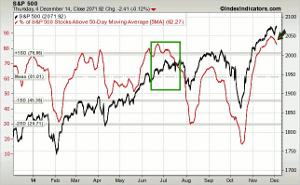
The 5-day MA of the % of S&P 500 stocks above their 50-day MAs turned down last week and was at 82% on Thursday. It is important to note that this is not necessarily a sign of a top but does indicate that a high number of S&P stocks are overextended.
Last summer, the 5-day MA turned down (see green box) in June, which was over a month before stocks turned lower. The sharp move in the 5-day period MA from the October lows can be interpreted as a sign of strength. Clearly, stocks that are coming out of bases can still move higher, even with that % at high levels.
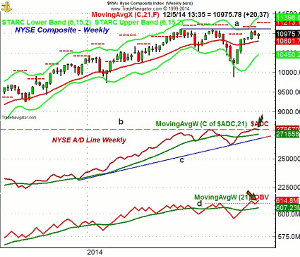
The weekly chart of the NYSE Composite (NYA) shows that it is still well below the July highs at 11,108, line a. The NYSE has been holding well above its 20-week EMA, as well as the quarterly pivot at 10,789.
The monthly projected pivot resistance is now at 11,273 with the weekly starc+ band at 11,398. The low last week and short-term support is at 10,864 with the quarterly pivot at 10,789.
The weekly NYSE Advance/Decline line has finally made a new high and is acting stronger than prices as the resistance at line b, has been overcome. The A/D line WMA is still rising gradually, which is a positive sign.
The weekly OBV broke out to new highs three weeks ago as resistance at line d, was overcome. It now shows a bullish zig-zag formation.
The McClellan oscillator is still in a downtrend as it has been since late October. It looks ready to close the week around -74, which could be setting the stage for a correction next week.
NEXT PAGE: Stocks
|pagebreak|S&P 500
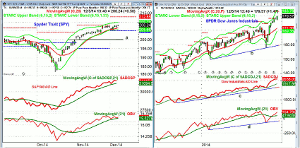
The Spyder Trust (SPY) dropped back to its 20-day EMA last week before turning higher. The daily starc+ band is at $209.74 with the monthly projected pivot resistance at $212.85.
On a close back below $205, and the monthly pivot, there is further support now at $203.13. The more important support is at $200 with the quarterly pivot at $196.19.
The S&P 500 A/D line made a new high again last week after dropping Monday to retest its WMA. It continues to act much stronger than prices. The daily on-balance volume (OBV) made a new high at the end of November and is still holding above its WMA.
Dow Industrials
The weekly chart of the SPDR Dow Industrials (DIA) shows a strong close last week. In November, it reached the monthly projected pivot resistance, which, for December, is at $182.94. This is just below the weekly starc+ band, which is now at $183.77.
The weekly A/D has moved sharply higher since it tested its WMA in October. It is acting very strong and is well above its WMA.
The weekly OBV is also rising sharply from the October lows but has not yet moved above the September highs. It is well above its rising WMA and the daily OBV has made a new all time high.
There is initial support at $177 with the rising 20-day EMA at $176.40. The September high, and further support, is at $172.73.
Nasdaq 100
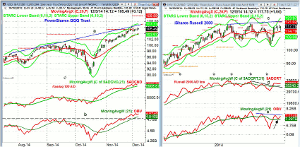
The PowerShares QQQ Trust (QQQ) looks ready to close the week a bit lower, after it exceeded the quarterly projected pivot resistance at $104.74 two weeks ago. The daily starc+ band is at $107.08 with the monthly projected pivot resistance now at $109.89.
The daily Nasdaq 100 A/D has made further new highs over the past two weeks and is still above its WMA, which appears to be flattening out.
The daily OBV is acting much stronger as it made a clear new high last week. The weekly OBV has not made a new high with prices and may turn lower this week.
There is minor support now $104.42 with the 20-day EMA at $103.85, along with the daily starc- band. The monthly projected pivot support is at $102.37.
Russell 2000
The iShares Russell 2000 Index (IWM) dropped down to a low of $114.81 Monday, which was just above the 20-week EMA at $114.18. IWM looks ready to close near the highs. Short-term resistance for the past few weeks is at $118.78 with more important in the $121 area, line a. The weekly starc+ band is at $123.95.
The weekly Russell 2000 A/D broke through its downtrend, line d, at the end of October and continues to hold above its slightly rising WMA.
The weekly OBV has turned up from its WMA, and with a higher close again this week, will look quite positive.
NEXT PAGE: Sector Focus, Commodities, and Tom's Outlook
|pagebreak|Sector Focus
The iShares Dow Jones Transportation (IYT) hit the weekly starc+ band at the end of November as it peaked at $167.80. The daily starc- band was tested last week before it rebounded, but it closed Friday near the lows. Once below $160, the monthly projected pivot support is at $158.14 with further support at $156, which was the September high.
The weekly relative performance and OBV analysis did confirm the highs but have turned lower. The daily studies do look toppy as they have just rebounded back to their WMAs.
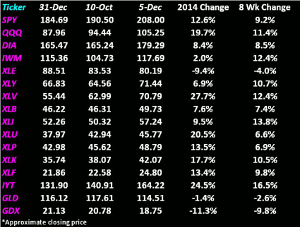
The Select Sector Health Care (XLV) has been stronger than IYT over the past two weeks and is leading the sector ETFs higher as it is up over 27%. IYT is up over 24% followed by a 20.5% gain in the Select Sector Utilities (XLU).
The PowerShares QQQ Trust (QQQ) is up close to 20% for the year, while the Spyder Trust (SPY) is up just 12.4%.
The Select Sector Technology (XLK) has continued to be strong as it is now up 17.7%, which is well ahead of the 13.4% gain in the Select Sector Financial (XLF).
The recent strength in the SPDR Dow Industrials (DIA) has pushed it above the Select Sector Materials (XLB) as they are up 8.3% and 7.5% respectively. The energy sector has continued to get hit hard as the Select Sector Energy (XLE) is down 9.5% for the year.
Interest Rates
The yield on the 10-Year T-Note dropped on Friday, but was still higher on the week, closing just above 2.3%. The yield is still below the declining 20-week EMA at 2.38%.
Precious Metals
The SPDR Gold Trust (GLD) and Market Vectors Gold Miners (GDX) are still trying to rebound from the early November lows, and while the volume analysis has improved, there are no clear signs yet that a bottom is in place. The GDX is acting better than GLD.
The Week Ahead
Despite the improvement in some of weekly technical studies, a short but sharp correction can not be ruled out before the end of the year. I think it is likely to be a buying opportunity as the correction may be more of a sector rotation.
I am watching the small-cap indices closely as they could breakout to the upside in the next week, which would change the overall tone of the market, despite the overbought status of the S&P 500 and Nasdaq 100.
Needless to say, I would not change your long-term investment strategy as the 2015 outlook for the economy and stock market has gotten even better. Stick with your dollar cost averaging positions even in the EuroZone as it may be a surprise winner next year.
I will continue to look for low risk opportunities in small-cap and other stocks where there are signs that the stock has just bottomed. I will be updating the recently recommended positions this week.
If you did raise some cash in market laggards, as recommended two weeks ago, there are likely to be better stocks to buy in the next few weeks. If you did put on some light hedges, I would stick with them but watch my Twitter feed for advice on when to cover them.
Don't forget to read Tom's latest Trading Lesson, Fibonacci Analysis: Master the Basics.

