With the S&P 500 registering its best weekly gain since July 2013 in a holiday-shortened trading week, MoneyShow’s Tom Aspray explores whether this current bull market still has legs.
Just a week ago the stock market was looking quite vulnerable as most of the major averages closed near their lows last Friday, April 11. There were signs of heavy selling, so I concluded last week that “On a short-term basis, the market is getting oversold, so we should see a bounce this week. Unless it is quite strong, it will likely be an opportunity to become more defensive and raise some cash.”
The higher close last Monday signaled the rebound was indeed underway and made Wednesday’s action pivotal as a sharply lower close would have signaled that the rebound was over and that investors should prepare for a further decline.
Instead, Janet Yellen’s clarifying comments at the Economic Club of New York seemed to calm the markets and bring in more buyers. She made it clear that the Fed would keep rates low as long as needed to be sure the recovery stayed on track.
She also seemed more worried about deflation than inflation as she said “inflation persistently below 2% could pose risks to economic performance.” The Fed continues to think that the recent soft data is due in part to the very hard winter.
This has been dismissed by many analysts early, but I continue to think much of the weakness is weather related. This was the spring thaw I discussed in February. The concern that a weaker economy would not support the lofty stock prices was one of the reasons many bailed out of stocks, especially those with suspect earnings.
So far, the earnings season has not been as bad as many feared. To be sure, there have been some big misses but also some results that were much better than expected. This earnings season may end up as a positive for the markets.
The S&P 500 closed higher each day last week and gained 2.7%, which was its best weekly performance since last July. The Nasdaq Composite was up 2.4% as the hemorrhaging in the tech and biotech stocks seems to be over. The sharp decline in these sectors and small-cap stocks is now looking more like sector rotation.
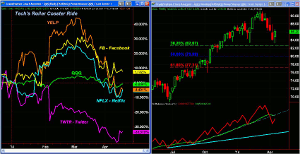
The % change chart of some of the consumer Internet stocks illustrated the wild swings, so far, in 2014. For example on March 4, Yelp Inc. (YELP) was up over 46% for the year, but as of last Thursday’s close, it is now down 4.5%. Facebook Inc. (FB) has done a bit better as it peaked a few days after YELP and was up close to 32%. It is still positive for the year but now shows just a 7% gain.
Twitter, Inc. (TWTR) has spent very little time in positive territory this year, and even though it has bounced recently, it is still down over 33% for the year. In comparison, the PowerShares QQQ Trust (QQQ) looks relatively stable as after being up almost 5% in March it is now down 0.8%.
The weekly chart of the PowerShares QQQ Trust (QQQ) shows that the decline has not yet reached the 38.2% Fibonacci support at $82.57. Therefore, there is no evidence of a change in the major trend. The weekly OBV did drop below its WMA and violated the uptrend from the September lows, line a. It has held well above the long-term support at line b and turned up last week.
Most of the major global markets have had a rough time, so far, in 2014 with the German Dax down 1.5%, the Hang Seng Index dropping 2.5%, and Japan’s NK225 even worse as it is down 10.9%. This poor performance, combined with the publicity blitz over Michael Lewis’ new book, has given many investors a reason not to buy stocks. I think that the misguided emphasis of the financial media, which I pointed out a few weeks ago, did a disservice to the investing public.
According the AAII, the percentage of bullish investors is now down to 27.2% after reaching 55% at the end of 2013. This reflects the increasing fear of or distrust of the stock market by many investors. Though this is bullish for stocks, it may keep the public out of the market until it is much higher.
NEXT PAGE: What to Watch
|pagebreak|Though there are still concerns over the situation in the Ukraine and the health of China‘s economy, I see signs of continued improvement in the global economy. It was just two years ago that many analysts were predicting that Greece would drop out of the European Union and that it might totally fall apart.
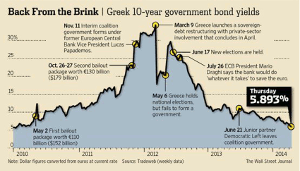
That is why I found this chart of Greek bond yields quite amazing as yields started to rise in 2011 when their economic plight worsened. In March 2012, the yield rose to over 30% after new austerity measures were passed and there were riots in Athens. Now the yield is below 6% and back to the levels seen in early 2010. Though the weaker Eurozone countries still have problems, they are getting better, which suggests to me that the Eurozone is on the mend.
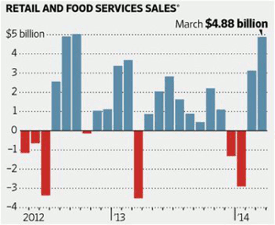
The next couple of months of economic data will be important. Last week’s Retail Sales rose 1.1%, which was the best gain in 18 months. The data for February was also revised upward leading many to conclude that the consumer was once again starting to spend. Nearly 80% of tax returns processed by early April resulted in an average tax refund of $2,792, which means consumers should have more to spend.
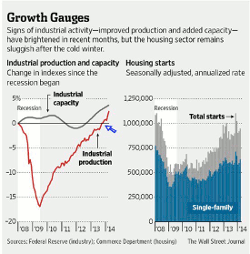
The Housing Starts and Industrial Production reports were also out last week and both beat estimates. Industrial Production is in a steep uptrend as it is back to levels last seen in 2007. Housing starts are still below last year’s level and the Housing Market Index was also weaker than expected. The data on the housing market will need to be watched closely in the months ahead as it is an important driver of economic activity.
Wednesday’s release of the Fed beige book was quite encouraging as they reported that of the 12 regions there was "modest to moderate" expansion in eight regions.” Most regions showed an improvement in manufacturing activity, though the Empire State Manufacturing Survey was flat last week. The outlook from the Philadelphia Fed Survey was much better as it jumped 7.6 points to its best level since last September.
This week we get Leading Indicators on Monday, along with the Chicago Fed National Activity Index, which is a weighted reading of 85 monthly national economic activity indicators.
More data on the housing market will be released this week with Existing Home Sales on Tuesday, followed by New Home Sales on Wednesday. The PMI Manufacturing Index is out on Wednesday, and on Thursday we get the jobless claims and Durable Goods. The week ends with the final monthly reading on consumer sentiment from the University of Michigan.
What to Watch
The market last week was a tough call after the PowerShares QQQ Trust (QQQ) and iShares Russell 2000 Index (IWM) had broken more important levels of support the week of April 11. The odds of a failing rebound would typically be quite high.
By lunch time, Wednesday, the strong market internals (3 to 1 advancing issues over decliners) shifted the evidence to a positive view that was confirmed by the strong readings again on Thursday.
The new highs in both the weekly and daily A/D lines reinforce the bullish intermediate-term outlook while the volume analysis is still mixed. The weekly readings are positive while the daily OBV analysis is still lagging the price action.
The chart patterns do allow for some backing and filling this week before the NYSE Composite (NYA), Spyder Trust (SPY), and SPDR Dow Industrials (DIA) could challenge their all-time highs.
Recent data suggests that many of the big hedge funds were hurt the most by the drop in the technology and biotechnology sectors. One $28 billion fund lost 4.2% in March and another 4%, so far, this month. Most also underperformed the averages like the S&P 500 in 2013.
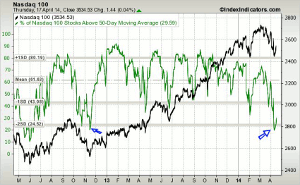
There clearly has been some improvement in other measures of the market’s health. The percentage of Nasdaq 100 stocks above their 50-day MAs dropped down to 20% but finished the week at 29.6%. This was the lowest reading since November of 2012 (see arrows). The five-day MA, which is a more reliable measure of trend is still declining and is at 23.6%.
For the S&P 500, the five-day MA has dropped to 47.1% with a daily reading in the 40% area before it turned up last week to close at 54.6%.
In last week’s trading lesson, I looked at the quarterly and monthly OBV analysis of four Dow stocks that show long-term patterns of accumulation.
NEXT PAGE: Stocks
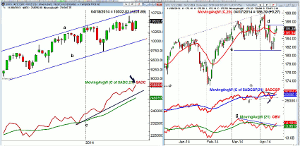
|pagebreak|The weekly NYSE Composite held above the quarterly pivot at 10,270 on April 11 as it closed at 10,280. It finished last week back above the monthly pivot at 10,450. The early April high was 10,669 with the monthly projected pivot resistance at 10,729.
The upper boundary of the weekly trading channel, line a, is now in the 10,830 area. There is some support now at 10,350 with the 20-week EMA at 10,280, just above the April 11 low of 10,271.
The weekly NYSE Advance/Decline surged to a new all-time high on Thursday’s close (see arrow) and the steepness of its ascent is similar to what was seen at the February lows. As I noted in Thursday’s 2 Bear-Beating Large-Cap Picks, the daily A/D line did test the support from the March lows but unlike the S&P 500 did not break below it. The daily A/D line also made a new high on Thursday.
The McClellan oscillator did break its support, at line c, which would often be consistent with a further wave of selling. Instead it rallied steadily from the April 11 low of -149 to close the week back above the zero line at +54.
S&P 500
The daily analysis of the Spyder Trust (SPY), improved further on Thursday after closing below the quarterly pivot at $183.25 the previous week. The key resistance is at $187.17 (line d), which was the prior week’s high. A move above this level should be enough to start squeezing those still on the short side.
The all-time high is at $189.70 with the monthly projected pivot resistance at $192.40. The weekly starc+ band is now at $193.20.
The S&P 500 A/D line dropped below the support at line f (see arrow) before reversing to the upside. It made a new high on Thursday as it broke its short-term downtrend with last Wednesday’s close.
The daily OBV has now moved above both its WMA and the downtrend, line h, but is still well below the March highs. The weekly OBV closed back above its WMA and triggered an AOT buy signal.
There is minor support now at $184.33 and then in the $183.60 area. A close below $181.31 would be a sign of weakness.
Dow Industrials
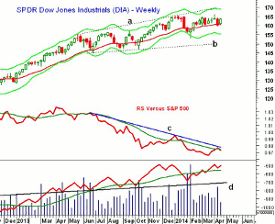
The SPDR Dow Industrials (DIA) closed on April 11 below the 20-week EMA and the quarterly pivot at $160.43. The reversal last week was pretty impressive and a close above $164.30 would signal a move to the high at $166.06.
The monthly projected pivot resistance is at $167.48 with the weekly starc+ band now at $169.21.
The 20-day EMA at $162.75 is initial support with further in the $161.30 area. The $160 level needs to hold on a closing basis.
The weekly relative performance has dropped back below its WMA, so the next few weeks will be important in determining whether it has bottomed. The daily RS line (not shown) is still in its uptrend but did turn lower on Thursday.
The weekly on-balance volume (OBV) held well above its WMA on the recent decline and has turned up once more. It is not far below its all-time highs. The daily OBV (not shown) tested its WMA before turning down.
The daily Dow Industrials A/D line (not shown) also made a new high last week.
Nasdaq-100
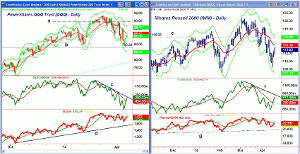
The PowerShares QQQ Trust (QQQ) made a new correction low last Tuesday at $83.28 (line b) before reversing to the upside to close at $86.20, well above the low. The 20-day EMA is now at $86.83. QQQ is still below the quarterly pivot at $87.34 with the last swing high at $89.68, line a.
The daily OBV rose sharply over the last two days of the week. It is now back above its WMA and is testing its downtrend, line c. The weekly OBV (not shown) has turned up but is still below its WMA.
The Nasdaq 100 A/D closed the week back above its WMA but has key resistance now at the early April highs.
There is minor support now at $85.50-70 with further at $84.
Russell 2000
The iShares Russell 2000 Index (IWM) also made a new low Tuesday at $108.66, which was just below the quarterly projected pivot support at $108.80. It closed the week at $112.92 but is still below the 20-day EMA at $114.10 with the quarterly pivot at $114.53. There is a band of further resistance now in the $116 area, line e.
The weekly OBV flipped back above its WMA after closing below it for one week. Therefore, the Aspray’s OBV Trigger (AOT) triggered a short-term buy signal. The daily OBV is now well above its WMA but still below the downtrend, line f.
The Russell 2000 A/D line closed just barely above its WMA but is still below the previous two peaks. The A/D line now has more important support at line g.
NEXT PAGE: Sector Focus, Commodities, and Tom's Outlook
|pagebreak|Sector Focus
The iShares Dow Jones Transportation (IYT) had a strong week as it held above important support in the $130-$131 area to close on the week’s highs. It looks ready to challenge the all-time highs at $137.98.
The monthly projected pivot resistance is at $140.89 with the weekly starc+ band at $142.23. The weekly relative performance and OBV (not shown) have held well above their WMA and have turned up sharply.
The Spyder Trust (SPY) is now up 0.9% for the year, while the SPDR Dow Industrials (DIA), iShares Russell 2000 Index (IWM), and PowerShares QQQ Trust (QQQ) are all still lower but IWM has reduced its yearly loss to 2.1%.
The Select SPDR Utilities (XLU) is now up 11.4%, while the Select SPDR Health Care (XLV) is well below the year’s highs and is now just up 2.6%.
The Select SPDR Consumer Discretionary (XLY) is still lagging the Select SPDR Consumer Staples (XLP) as it is down 4.6% while the XLP is up 1.5%. If I am right about a resurgence in consumer spending in the next month or so, this relationship is likely to change.
The Select SPDR Financials (XLF) is now flat for the year while the Select SPDR Materials (XLB) is up 2.8%.
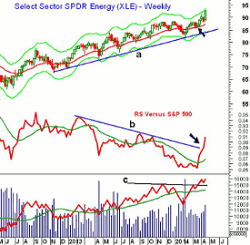
The Select SPDR Energy (XLE) is the clear leader as it closed last week at new all-time highs. It is up 4.8% for the year and is just below its weekly starc+ band at $93.59. The monthly projected resistance at $92.11 has already been overcome with the quarterly projected resistance at $94.89.
This sector was identified on April 10 as a new market leader and both SPDR Oil & Gas Exploration (XOP) and Laredo Petroleum Holdings, Inc. (LPI) are also doing quite well.
Crude Oil
Crude oil closed the week higher as it made new highs for the year in the June contract. The weekly OBV stayed positive throughout the pullback in March and has confirmed the new highs.
Precious Metals
The SPDR Gold Trust (GLD) closed the week just below its quarterly pivot at $124.80 as the correction from the highs has been quite sharp. Janet Yellen’s comments regarding inflation did not help. The short-term momentum is clearly negative while the weekly OBV divergences favor looking for new buy signals at lower levels.
The Week Ahead
It looks as though the Spyder Trust (SPY) has escaped the sharper correction I was concerned about last time. We are starting to see some better economic data, and this week’s numbers, as well as earnings may be supportive.
I do expect some sort of pullback this week but it would take a day or two of very negative market internals to neutralize the positives from last week’s trading.
As I noted in my review of the energy sector, some stocks are looking very good and others like IBM dropped into long-term support (and our buy zone) on its earnings but closed well above the lows.
When investors are nervous, they often turn to the large-cap high-dividend plays, and there are several already in the portfolio. I recommended two large-cap ETFs last week in 2 Bear-Beating Large-Cap Picks that give can give you exposure to both US and global large-cap stocks. They need a slight pullback to reach my buy levels.
I will be adjusting the stops in the Charts in Play portfolio this week as some of our positions were stopped out in the last two weeks. Given the readings from the % of stocks above their 50-day MAs, the market is now at a much lower risk area, so I will be looking for new buy candidates.
I will be watching some of the beaten-down tech and biotech stocks, but I think they may need some time before they can give solid new buy signals.
Stick with the dollar cost averaging positions in either the S&P 500-tracking ETF or Vanguard Emerging Markets (VWO) that I discussed in the January 24 column, A Path to Investing Success in 2014. The VWO is very close to breaking above a long-term downtrend line, and I will look for an entry in my daily charts column.
Those who were not in the market should have started a dollar cost averaging plan on April 11 as the S&P 500 had closed below 1830 the previous day. Make another equal purchase next Friday and then three more every two weeks.
Don't forget to read Tom's latest Trading Lesson, 4 Dow Stocks Under Accumulation.

