In all his years trading, Bob Lang, of ExplosiveOptions.net, has tried many different tools and approaches, however, he’s found the Chaikin Analytics platform to be the one system that stands out head-and-shoulders above the rest; today, Bob explains what it is and how to use it.
Imagine trying to arrive at a new destination without a road map (or GPS or Siri). You’ll get lost, stop and ask for directions, and hope you safely arrive before too long.
The same holds true for trading and investing, especially in today’s tough market. If you’re not armed with the right tools then you’re simply wandering around, completely lost. In all of my years trading, I have tried many different tools and approaches, but there is one system that stands out head-and-shoulders above the rest.
The Chaikin Analytics platform can raise your game to another level.
How Chaikin Analytics Works
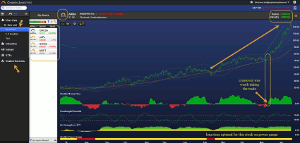
Basically, you can filter and create custom lists of the stocks whose charts you are most interested in. Each chart is self-explanatory. The top pane tells us a great deal of information at a glance, so there is no need to spend too much time studying (click on the chart at the right to open it up and see for yourself).
This is the chart of recent high-flyer Ambarella (AMBA), a strong stock in a strong industry. It just backed off to neutral territory, which you can see in the indicators on the bottom (money flow, overbought/oversold). Of note: the money flow went green just as the stock was ready to surge in May. When I penned this article around that time for realmoneypro.com, the stock was about $89 and it subsequently went up to $124 a month later.
Why I Use Chaikin Analytics
The crispness of the design makes it easy to spot patterns—which is very important—I like them to pop out at me. Additionally, many of the features do the hard work for you, plus, as I mentioned above, you can change the analytics to fit your personal preference. The indicators that you see in the lower pane offer some of the most unique and congruous set of data for a technician. (Personally, I like to see everything line up with price and volume.)
For those who need more analytical help, the hot lists are great tools to find the best trends. In addition, there are videos and tutorials to help you get on your way.
Two of my favorite elements are the Power Gauge Report and Chaikin Insights. In addition, the portfolio health check is a comprehensive look at the portfolio you create and how it is performing relative to the market, with Power Gauge alerts, earnings revisions, surprises, and the Chaikin Power Grid. All told, these analytics provide a wealth of data and information that will guide you along the way to making better trade decisions.
Chaikin Analytics really makes my life easier. I need to make quick decisions as an options trader, which means I cannot spend too much time trying to figure out if a pattern is going to work or whether it’s bullish or bearish. I need precise and definitive data and this platform delivers on all levels.
By Bob Lang of ExplosiveOptions.net


