
Most traders have experienced the chaotic way that markets react to news, but there's a tool that can help cut through that noise and determine whether market direction is about to change, writes Charles Cochran of Cochran Nannis Futures Trading.
The most important question facing a trader on each trade is "what is the market's direction?" If you get the correct answer to this question, the rest of the analysis falls into place automatically. When one gets the direction of the market right, he can make money; unless one buys the high or sells the low. How can one get the direction right when continuously bombarded with news and opinions that support either side of the market?
As traders grow they become adept at assembling the seemingly endless stream of news and data into its proper context by importance and relevance for their particular trades. The previous news, the current news and anticipated news all combine to yield a generally bullish, bearish, or neutral outlook for the market. Once this assessment is completed, the trader can work the current trend or bracket as per his methodology. This will continue until the news changes.
Once the assessment of the fundamentals is completed, the trader will need to look at the market's structure, the market's current location within that structure, and whether current conditions suggest continuation or change. And last but not least, the trader has to think about what news it would take to change this. Good traders anticipate and don't react. They trade based on their terms and not the market's terms.
As most of us have learned, the market's reaction to the news can be all over the place with some news producing the expected reactions and some not. It really is enough to make one stop his fundamental analysis.
Is there an easier way to see whether the market has changed or not, or is about to change? I believe the answer is yes, when you use the longer-term market profile charts. The monthly (F1) and daily (F2) market profile charts capture the market's underlying trends and bias for the two primary timeframes that drive markets. When one learns to read this information, the answer to the question of "which side" of the market to trade is answered.
Through the market profile one doesn't have to know why the market is going up, or who or what, is driving the market directionally. He can see the effect of the buying or selling in the skewing of the profiles/distributions and then trade accordingly.
NEXT PAGE: Examples of Market Profile in Action
|pagebreak|In Chart 1 below, when you look at the price action in the E-mini you can see that the market was in a trading range from August 2012 through December 2012 before breaking out to higher levels in January.
The market had long-term buying below 1350 and selling above 1450. In December, the market came into balance with a buyer below 1395 and a seller above 1440. This trading range was created from the uncertainty of the Presidential election, the economic outlook, the "fiscal cliff" and debt ceiling. Once the Fed and Congress acted after the election to maintain current spending levels and raise the debt ceiling as needed, the market was assured that the status quo was preserved and it would be business as usual, and the market broke out to the upside.
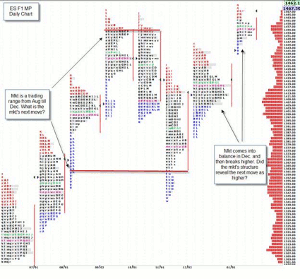
Click to Enlarge
Was there anything in the market profile information that could have told one that the next move was up when the market came into balance in December? The news that took the market higher was the last-minute deal that avoided the "fiscal cliff," raised taxes on the wealthy, didn't cut spending, and pushed the debt ceiling talks into spring. This, coupled with Fed's accommodative monetary policy, insured that the trading/investing strategies that had worked previously would continue to work and players bought stocks taking the ES to new highs.
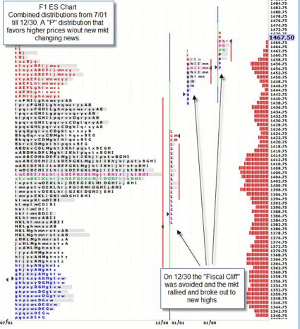
Click to Enlarge
If you look at the F1 chart above, you can see that the distribution from 7/01/12 till 12/30/12 was a "P", which favored higher prices, when all the news, participants, and other factors were rolled together. The collective wisdom favored the long side of the market and the market eventually rallied in 2013 and took out the previous high at 1468.
The foreknowledge that the market's bias was to the upside would have allowed one to buy when the market was below 1390 in anticipation of a retest of the recent highs at 1455/68, or higher. And for those that were short, it would have alerted them to not press the short side of the market and overstay their short positions.
When one first starts trading the seeming depth and breadth of all that one could cover is overwhelming. All traders from complete beginners to master traders need to find an organizing principle to assemble and evaluate the market for their trades. I believe this organizing principle is the market profile. Through the market profile, one can see the collective effect of the market's participants, and then position with them. You really don't have to know the markets in the detail that conventional wisdom dictates. You can look at the market profile and just "see" whether you should be long of short and then take the trade.
By Charles Cochran, Co-Founder & Managing Partner, Cochran Nannis Futures Trading


