
Two healthcare picks from February appear to have now completed their corrections, which illustrates why patience is often needed when buying the dips, so MoneyShow’s Tom Aspray takes to the charts to determine the next step to take.
Last week’s gains were impressive and consistent with the strength in the market internals, yet stocks are likely to face quite a few hurdles this week. This is the largest week for earnings with Apple, Inc. (AAPL) reporting after the close today. It was recommended last week and rallied late in the week.
On Wednesday, we have the advance reading on 1st quarter GDP in the morning and the FOMC announcement in the afternoon. As I discussed in the Friday’s Week Ahead column, the positive technical readings still allow for a pullback this week. The futures are higher in early trading as most Asian markets were quite strong on Monday.
Though the Sector Select Health Care (XLV) was not one of strongest sectors last week, it is up over 9% YTD, well outpacing the 3.4% gain in the Spyder Trust (SPY). Two healthcare picks from February’s Buy More Stocks in a Top Sector appear to have now completed their corrections. This illustrates why patience is often needed when buying the dips.
Click to Enlarge
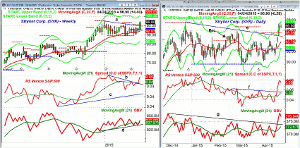
Chart Analysis: Stryker Corp. (SYK) is a $35.8 billion medical technology company that has a yield of 1.50%. They beat on earnings last week while revenues met expectations. The stock is up just over 3% YTD.
- The weekly chart shows last week’s strong close above weekly resistance, line a.
- SYK has held the quarterly pivot during the 1st quarter.
- Last week it tested but held the new 2nd quarter pivot at $92.53.
- The quarterly pivot resistance is at $98.86 with the weekly starc+ band at $100.35.
- The relative performance broke its downtrend, line b, in early April and then moved strongly above its WMA.
- The weekly OBV has moved back above its WMA but is still below the early 2015 highs.
The daily chart of Stryker Corp. (SYK) shows last week’s rally above the upper boundary of the continuation pattern at line e.
- SYK has closed at the daily starc+ band for the past three days so a pullback would not be surprising.
- The breakout level is at $95 with the rising 20-day EMA at $93.78.
- The 2015 trading range is $6 wide so the upside target is in the $100-$102 area.
- The daily relative performance broke through resistance, line f, one day ahead of prices, signaling SYK was a market leader.
- The daily OBV shows a similar upside breakout and is well above its rising WMA.
- SYK was recommended on February 17 and hit the second buying level in early March (see circle).
Next Page: Another Healthcare Stock to Watch
|pagebreak|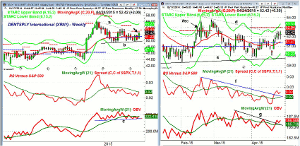
Click to Enlarge
DENTSPLY International (XRAY) has a market cap of $7.46 billion and is a developer and marketer of disposable dental products. They report earnings on May 6 and are currently down 1.5% YTD.
- The triangle formation on the weekly chart (lines a and b) was completed last week.
- XRAY dropped to a low of $49.81 three weeks ago as support at line b, was tested.
- The weekly starc+ band is at $55.27 with quarterly pivot resistance at $55.76.
- XRAY had a high of $56.10 in December with upside targets from the flag in the $58-$60 area.
- The weekly RS is just barely below its WMA but has turned up.
- The OBV has held support and is now back above its WMA.
- The 20-week EMA and initial weekly support is now at $51.22.
The daily chart shows that Friday’s close in DENTSPLY International (XRAY) was just above the daily downtrend, line d.
- There is monthly pivot resistance at $52.94 with the late February high at $53.77.
- A close above this high would be a sign of strength.
- The quarterly pivot is at $51.34 which is just below the 20-day EMA at $51.47.
- The daily relative performance formed a negative divergence at the February highs, line f, and this resistance has now been overcome.
- The daily OBV has also broken its downtrend, line g, which is a positive sign.
- Both buy levels were hit on the sharp drop in the middle of March and these lows were slightly broken in early April but the stop at $49.22 held.
What it Means: These two examples demonstrate that—when you are looking to establish a long position on a pullback based on the weekly analysis—it can sometimes take quite a while before the position starts to pan out.
Both of these stocks need to rally further to confirm a significant new weekly uptrend and to signal significantly higher prices. The next few weeks will tell us more but would take some partial profits at the minimum upside targets.
Portfolio Update:: For Stryker Corp. (SYK) should be 50% long at $93.88 and 50% at $92.76, raise the stop now from $89.33 to $90.87. Sell 1/3 at $103.77.
For DENTSPLY International (XRAY) should be 50% long at $51.32 and 50% at $50.46. On a move above $53.80 raise the stop from $49.22 to $50.44. Sell 1/3 at $55.08.


