By studying the monthly charts, one can often isolate those stocks that are closest to major chart support and those that could bottom out, so MoneyShow’s Tom Aspray takes a technical look at four beaten down Dow stocks that have the most interesting long-term charts.
After a promising close Monday, stocks reversed to the downside in late trading on Tuesday. The Dow Transports bucked the trend while the small- and mid-cap stocks were a bit weaker that the S&P 500.
Clearly, many are on the sidelines ahead of Alcoa, Inc. (AA) earnings after the close today. Expectations are very low, so any stocks that beat expectations are likely to be rewarded and weak results may already be factored into many stock prices.
The large-cap stocks, whose earnings have been hurt by the much stronger dollar, are likely to get most of the focus. The iShares Dow Industrials (DIA) is up 0.83% YTD while the Spyder Trust (SPY) has done a bit better gaining 1.29%. Both are lagging well behind the 4.32% gain in the small-cap iShares Russell 2000 (IWM).
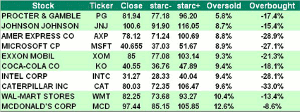
The monthly starc band scan of the stocks in the Dow Industrials shows that Procter & Gamble (PG) is the most oversold as it closed March just 5.8% above its monthly starc- band. Of course, this does not mean that PG cannot decline further but it identifies the stock as being in a higher risk sell area.
By looking at the monthly charts, one can often isolate those stocks that are closest to major chart support and those that have technical readings that suggest they could bottom out in the next few months. These four stocks have the most interesting long-term charts.
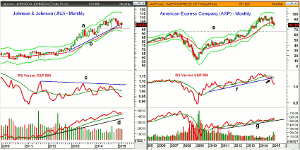
Chart Analysis: The monthly chart of Johnson & Johnson (JNJ) is down 3.51% YTD and has a current yield of 2.80%.
- The long-term chart shows that the uptrend, line b, was violated in February as the 20-month EMA was tested; it now stands at $97.71.
- The monthly support for April at $98.08 has already been tested.
- The high from 2012, line 1, and stronger support is now in the $96 area.
- The monthly RS line dropped below its WMA in late 2014 and is still declining.
- The relative performance needs to move above the resistance at line c, to signal it is a market leader.
- The monthly OBV did peak with prices in November and is holding well above its WMA.
- The weekly studies are negative and show no signs yet of bottoming.
- There is key resistance now in the $103.50 area.
American Express (AXP) has had a rough year so far as it is down 15.25% as the loss of its exclusivity with Costco did not help.
- AXP is still trying to hold above the February low at $76.86.
- There is monthly pivot support at $73.80.
- There is major chart support from the 2007 high at $66.13.
- The monthly relative performance broke its uptrend, line f, in December 2014.
- The RS line is well below its declining WMA and it would take some time before it could bottom out.
- The monthly OBV has held up better as it is still in a gradual uptrend, line g.
- The weekly OBV rallied sharply in March but is still in a downtrend.
- Initial resistance and the 20-week EMA is at $83.02.
Next: Two More Stocks with Interesting Long-Term Charts to Watch
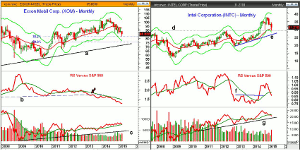
|pagebreak|Exxon Mobil Corp. (XOM) has been declining since it peaked last June as it is down 8.55% over the past year. It has a current yield of 3.22%.
- The major 38.2% Fibonacci retracement support at $82.05 was tested in March.
- The monthly starc- band is at $77.08 with the 50% support level at $75.79.
- The monthly RS dropped below multi-year support, line b, in April 2013.
- This warned in advance of the slide in XOM’s stock price.
- The monthly OBV is still rising and is barely above its WMA.
- The weekly studies are negative and have not yet formed any positive divergences.
- A close Friday above $86.00 will trigger a weekly HCD buy signal.
- The quarterly pivot is at $87.04.
Intel Corporation (INTC) triggered a large decline in the semiconductor stocks when it lowered the 1st quarter revenue forecast last month. INTC is down 13.20% YTD and has a current yield of 2.93%.
- The support from the 2012 high, line d, has now been tested.
- The longer-term uptrend, line e, is now in the $26.70 area with monthly pivot support at $26.50.
- The monthly relative performance confirmed a bottom formation in June as it moved above resistance at line f.
- INTC rallied for the next six months as it reached the monthly starc+ band several times before it reversed.
- The RS line is back below its WMA but I would look for a higher monthly close as a positive sign.
- The volume increased in March which has dropped the OBV below its WMA.
- There is further OBV support at line g.
- The quarterly pivot is at $32.60 with the declining 20-week EMA at $33.09.
What it Means: These high yielding stocks are likely part of some dividend portfolios or are being watched by those looking for yield. Of course, some are wondering if the large oil companies like Exxon Mobil Corp. (XOM) will be forced to cut their dividend.
I think this is unlikely and a drop in any of these four stocks back to stronger support will make their yields even more attractive.
Currently, American Express (AXP) looks the most vulnerable to a further decline while Johnson & Johnson (JNJ) and Intel Corporation (INTC) look the most interesting.
How to Profit: No new recommendation.


