US equity ETFs have seen outflows in 2015 of $16.9 billion, the highest level since the market low in 2009, so MoneyShow’s Tom Aspray examines the daily technicals to see whether this is bearish sign for the US markets.
The stock market selling continued Wednesday but most of the major averages closed well above the day’s lows. The March S&P 500 futures closed 10 full points above its lows and they are higher in early trading Thursday.
Many are expecting that today’s Factory Orders will reverse the five month decline but the key is likely to be latest update on the ECB’s quantitative easing plan and Friday’s monthly jobs report. The euro slid to an eleven year low in early trading as the 1.10 level is now being tested.
The recent market weakness has reduced some of the bullish sentiment as the percentage of bullish investors, according to AAII, dropped from 45.37% last week to 39.80% this week. The lowest five month reading was 35.49% and came on February 2 as the markets were making their lows.
According to Markit, the US equity ETFs have seen outflows in 2015 of $16.9 billion which is the highest level since the market low in 2009. Funds have been flowing into both Japan and the European ETFs, but I am not convinced this is bearish sign for the US markets.
Others are pointing to the Nasdaq Composite’s failure at 5000 to support a bearish case. But the daily technical studies do suggest that a bit more selling is needed to bring more bears out of hibernation and to complete the market’s correction.
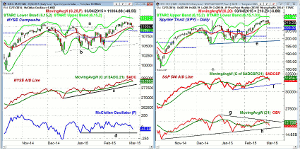
Chart Analysis: The NYSE Composite dropped below its 20-day EMA during Wednesday’s session but then closed the day above it.
- The NYSE has been able to hold above the monthly pivot at 10,900 and the support at line a.
- A retest of the breakout level is quite typical with further support at 10,750.
- The quarterly pivot is at 10,597.
- The NYSE A/D line has pulled back to its rising WMA and is well above the support at line c.
- The McClellan oscillator has dropped back below the zero line, closing at -45.
- There is next support now in the -130 area, line d.
- A close back above Monday’s high at 11,103 would be positive.
The Spyder Trust (SPY) was down 0.42% after dropping down to the $208 area.
There is further support in the $207.50-$208 area with the monthly pivot at $206.92.
- The S&P 500 A/D line peaked on February 24 and formed a slight negative divergence at Monday’s high.
- The A/D line has dropped below its WMA with next support at the January highs.
- The A/D line has more important support at line f.
- The weekly A/D line (not shown) did make a new high in February and is still above its rising WMA.
- The daily on-balance volume (OBV) has dropped back below its WMA after forming lower highs, line g.
- The support at line h is now more important.
- There is short-term resistance now in the $210.60-$211.20 area.
Next: Two More Major Averages to Watch
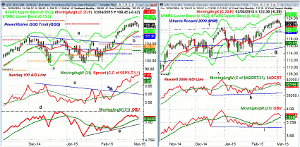
|pagebreak|The market leading PowerShares QQQ Trust (QQQ) looks much stronger technically. So far, the correction has held above the 20-day EMA and the starc- band in the $107 area.
- There is further support in the $105.90 area.
- This corresponds to the monthly pivot and the November high, line a.
- The former breakout level, line b, is now in the $104 area.
- The Nasdaq 100 A/D line broke through its downtrend, line c, on February 12.
- It has since accelerated to the upside and made a series of new highs.
- The A/D line is well above its rising WMA.
- The daily OBV has pulled back to its WMA but has failed, so far, to move above the December highs, line d.
- The OBV has stronger support at line e.
- The daily starc+ band is at $110.36 with the monthly projected pivot resistance at $114.89.
The iShares Russell 2000 (IWM) has continued to grind higher after surpassing the December high at line f.
- The 20-day EMA at $121.50 was tested Wednesday with the daily starc- band at $120.71.
- The monthly pivot is at $120.11 with a band of support at the $118.50-$119.50 area.
- The Russell 2000 A/D did make new rally highs this week but has now dropped below its WMA.
- The A/D line has failed to surpass the late December high.
- The daily OBV has turned lower but is still well above its WMA.
- It has also not yet made a new high with prices.
- The daily starc+ band is at $125.03.
- The monthly projected pivot resistance is at $129.09.
What it Means: In the February 4 column Do Stocks Have Enough Juice to Breakout? I made the case for why stocks could breakout to the upside despite the increase in bearish headlines. There were no warning signs of a significant correction at the time.
Though the daily studies are not all as strong as I would like, they are still positive. If the major averages does a rally failure at the recent highs in the next week, or so, then we may see a further correction.
It is possible that the bearish sentiment has already reached high enough levels to set the stage for another push to new all time highs. A higher weekly close will be a positive sign.
How to Profit: For the PowerShares QQQ Trust (QQQ) go 50% long at $107.32 and 50% long at $106.14 with a stop at $102.12 (risk of approx. 4.5%).
Portfolio Update: Traders are 50% long the iShares Russell 2000 (IWM) at $116.88 and 50% long at $114.96 with a stop now at $114.14. On a move above $123.80 raise the stop to $116.18.
Traders are 50% long the Spyder Trust (SPY) at $200.80 or better and 50% long at $200.20 with a stop now at $197.38. On a move above $212.30 raise the stop to $205.88.


