This tech powerhouse has been one of 2015's early winners, so given its recent rally, MoneyShow's Tom Aspray technically analyses the charts to determine the next move for option traders to take.
The major averages traded in narrow ranges last week as they closed lower Friday in reaction to weaker than expected preliminary 4th quarter GDP report. Inside the report there were some positive signs while February's University of Michigan's Consumer Sentiment improved to 95.4 from 93.6 the prior month.
February was a great month for stocks with the PowerShares QQQ Trust (QQQ) up 7.2% for the month and the Spyder Trust (SPY) up 5.6%. This may be the start of the melt-up move in stocks I discussed on February 13.
If this is the case, the pullback that began last week should be short lived as the upside breakout in the NYSE Advance/Decline line does favor further market gains in March. There is plenty of economic data out this week culminating with the monthly jobs report on Friday.
One of 2015's early winners has been Apple, Inc. (AAPL), which is up 16.81% YTD, though it was down slightly last week with a 1.50% drop last Friday. On the day ahead of Apple's earnings in January, the multiple time frame analysis had turned positive for the stock.
Therefore, I concluded that AAPL was a buy at lower levels as I said "I have no idea what the earnings will be, but the analysis of the monthly, weekly, daily, and the intraday charts strongly suggest that the worst of the correction in Apple's stock is over. A drop on an earnings' disappointment should, therefore, be a good buying opportunity."
Instead, AAPL
dropped 3.5% before reporting its earnings after the close as our recommended
buy levels in the stock and a specific option were hit. But after its recent
strong rally, what should you do now with your Apple stock?
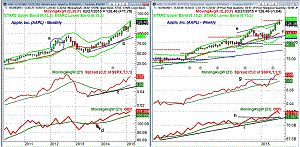
Chart Analysis: The monthly chart of Apple, Inc. (AAPL) shows that it had tested the starc+ band in February. For March it is at $133.97.
- As I noted last time, it was also tested last November, which was followed by two months of sideways trading before it gained 10% in February.
- The monthly relative performance moved above its WMA in April 2014 just after AAPL had pulled back to its rising 20-month EMA.
- The RS line made a new high with prices last month and is well above its rising WMA.
- The monthly OBV completed its bottom formation in September 2013 (point d).
- Over the past seventeen months, the OBV has continued to make higher highs.
- There is monthly support now at $115.62 which was the February low.
The weekly chart of Apple, Inc. (AAPL) reveals that it made a high last week of $133.60 before closing a bit lower.
- The quarterly projected pivot resistance at $132.76 was slightly exceeded as was the upper boundary of the trading range, line e.
- The starc+ band this week is at $135.03.
- For March, the projected pivot resistance is at $143.57.
- The weekly RS line broke through resistance, line g, at the end of January.
- It had dropped below its WMA on the correction in January.
- The weekly OBV also broke through its resistance, line h, on January 30.
- The OBV analysis has been positive since October 2014 when it moved above its WMA.
- The OBV did make a new high two weeks ago, but turned lower last week.
- The monthly pivot is at $125.87 with the projected pivot support at $118.19.
Next: Two More Apple Charts to Watch
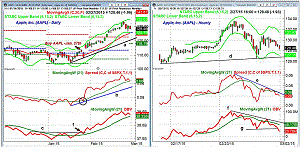
|pagebreak|On the daily chart of Apple, Inc. (AAPL) I have highlighted the daily of my January analysis.
- AAPL opened lower at $111.98 on January 27, the day my buy recommendation was released.
- It gapped $8.46 higher the following day and has not looked back since.
- The low last week was $126.61 with the 20-day EMA at $125.18.
- On earnings' day, the RS line dropped below its WMA before reversing to the upside (see circle).
- The relative performance did make a new high last week with prices.
- The RS line is now close to its rising WMA.
- The daily on-balance volume (OBV) turned positive three days before its earnings (point 1) as resistance at line c, was overcome.
- The OBV was strong last month and is still well above its rising WMA.
- There is initial resistance at $130.87 and a close back above $131.60 will signal a resumption of the uptrend.
- The daily starc- band is at $135.02.
The hourly chart of AAPL shows the past two weeks of trading as it traded above its starc+ band at the start of last week.
- The hourly starc- band is at $127.15 with further support, line d, in the $126.80 area.
- The hourly relative performance dropped below its WMA last Tuesday and is still in a steep downtrend, line e.
- The RS line needs to move above last Thursday's high to signal that the correction is over.
- The hourly OBV formed a slight negative divergence at last weeks high.
- The OBV shows a pattern of lower lows after support at line g was broken.
- The OBV now needs to move back above its WMA and the downtrend, line f, to turn positive.
- The 20-hour EMA is at $129.71 and a strong move back above the EMA would
be positive.
What it Means: The monthly and weekly technical studies are still positive, and as I noted in January, that meets "the requirement of the A Six-Point Checklist for a Profitable 2015. In January, the missing ingredient was "the low risk entry point" which the market provided in the hours leading up to Apple's earnings report.
The March 105 calls closed on January 27 at $7.95 well below my recommended buy level at $8.88 or better. These options will expire on March 20 and I would look to take profits on the next rally. There is a chance that AAPL will make another new high in the next two weeks.
I would continue to hold the long positions in the stock but would now raise
your stop.
How to Profit: No new recommendation.
Portfolio Update: Should be 50% Apple, Inc. (AAPL) at $110.72 or better. The second buy level at $108.58 was just missed as the 1/27 low was $108.60. Use a stop now at $112.89 until there are signs of a weekly top.
Option traders should have bought the March $105 at $8.88 or better. They hit
a high last week of $28.50 and closed at $23.70. Would sell at $26.20 or better.
Stay tuned to my Twitter feed for future updates.


