Many investors buy based on yield alone, but MoneyShow’s Tom Aspray thinks more fundamental and technical research is needed before making the decision to buy a high yielding instrument, so he looks at several REITs from a technical basis to determine if any are worth buying now.
Stocks closed mixed Tuesday as both the Dow Industrials and S&P 500 finished the day a bit lower. The Dow Transports led the way gaining 1.29% followed by the 0.55% gain in the small-cap S&P 600. Despite the recent new market highs, many of the largest US companies are still oversold.
In Tuesday's trading, the declines led the advances by a small margin on the NYSE Composite as it was down 0.62% for the day. Very strong economic data Tuesday, as August’s ISM Manufacturing report soared to 59 as most were expecting a reading of 57. This was the highest reading since March of 2011.
The continued search for yield by investors has pushed the DJ US REIT Index (DJUSRI) to a 17.8% gain for the year compared to the Spyder Trust’s (SPY) 9.6% gain. Many investors buy based on yield alone but I have long advised that you need to do much more fundamental as well as technical research before you buy a high yielding instrument.
For many years, I have recommended that investors avoid Annaly Capital Management, Inc. (NLY) because of its very weak technical outlook. This was more important than its high yield and for the past three years NLY has had a total return of -0.50%.
So, how do the REITs look from a technical basis and are any worth buying now?
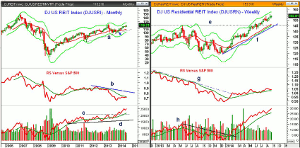
Chart Analysis: The DJ US REIT Index (DJUSRI) includes all seven of the specialized REITs. It formed a doji in December 2013 and then triggered a HCD buy signal in January.
- The index has closed higher six of eight months so far in 2014.
- The recent high is at 120.06 while in 2013 it had a high of 122.69.
- The monthly starc+ band is at 127.12.
- DJUSRI formed monthly dojis in both June and July.
- This makes the support at 114.74 and 113.39 now more important.
- The rising 20-month EMA is at 109.27.
- The monthly relative performance has just rallied back to its declining WMA.
- The RS line has major resistance now at line b.
- The weekly RS line (not shown) has dropped below its WMA.
- The monthly OBV continues to look very strong as it broke through resistance, line c, in January 2014.
- The weekly OBV (not shown) did make a new high last week.
One of the strongest specialized REITs has been the DJ US Residential REIT (DJUSRN), which is up 27.4% YTD.
- On June 6, the index closed above the 2013 high, line e, which was very positive.
- The weekly starc+ band is now at 157.24 with the monthly at 162.53.
- On the weekly chart, the most recent swing low is at 148.57.
- DJUSRN has been above its 20-week EMA since the end of January.
- The rising 20-week EMA is now at 146.35.
- The weekly relative performance broke its downtrend, line g, during the first week of February.
- The RS line has stayed in a gradual uptrend and kept above its WMA.
- The breakout in the OBV came at the end of January as the resistance, at line h, was overcome.
- The OBV is still confirming the price action.
NEXT PAGE: Two More REITs to Watch
|pagebreak|AvalonBay Communities, Inc. (AVB) is a $20.2 billion developer of multi family communities. It has a current yield of 2.89%. It has a current ratio of 1.38 and continues to estimate higher earnings.
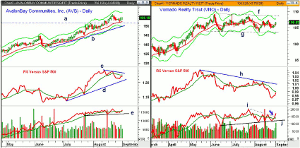
- The daily chart shows that the 20-day EMA was tested last Thursday.
- AVB started the month above its monthly pivot at $152.59 with the August high at $156.16.
- The monthly starc+ band is at $159.27 with the projected monthly pivot resistance at $161.25.
- The daily relative performance formed a slight negative divergence, line c, at the recent highs.
- The RS line is still below its WMA but above its uptrend, line d.
- The weekly relative performance (not shown) is holding well above its rising WMA.
- The daily OBV has just moved above its WMA and appears to have held short-term support at line e.
- There is more important support in the $150 area with the monthly projected pivot support at $149.03.
The Vornado Realty Trust (VNO) is a $20.1 billion diversified REIT that invests in commercial real estate. It has a yield of 2.80% with a current ratio of 5.38.
- The daily chart shows that VNO has been in a broad trading range, lines f and g, since May.
- VNO has next resistance at $107.38, which was the August high, with the daily starc+ band at $107.57.
- A strong close above $109 would complete the trading range with first upside targets in the $115-$116 area.
- The quarterly pivot resistance is at $115.94.
- The daily relative performance has formed lower highs since May.
- The RS line has turned up but is still below its WMA.
- The daily on-balance volume (OBV) has moved above its short-term downtrend, line I, as volume has picked up over the past two days.
- Both the weekly and monthly OBV (not shown) are both positive.
- The quarterly pivot and stronger support is at $103.28.
What it Means: Technically, the REITs continue to look positive despite the strong gains that many have already recorded this year. For new positions, the daily chart of Vornado Realty Trust (VNO) looks the most compelling to me even though AvalonBay Communities, Inc. (AVB) also continues to act well.
Of the REIT ETFs, the Vanguard REIT ETF (VNQ) is already up 4.3% from the early August lows and has an attractive yield of 3.05%. It has a very low expense ratio but no good risk/reward entry at current levels.
How to Profit: For the Vornado Realty Trust (VNO) go 50% long at $106.31 and 50% at $105.48 with a stop at $102.88 (risk of approx. 2.8%).


