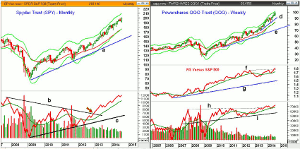
On-balance volume (OBV) analysis has given positive signals several times during this bull market, so MoneyShow’s Tom Aspray looks at the current monthly OBV analysis of four key markets to prepare traders for a new month of trading.
As August draws to a close, the stock market—based on the Spyder Trust (SPY)—looks ready to record the best August performance since 2000. In 2009 and 2012, the gains in August were followed by an S&P 500 return of 3.68% and 2.43% respectively.
With one day left in August there are signs that the market has lost some short-term upside momentum though no top has been completed yet. The strong reading from the NYSE Advance/Decline Line is a positive for both the intermediate- and long-term trend.
The A/D analysis has kept me on the right side of the market since the spring of 2009 as the sharp drops in 2010, 2011, and 2012 were identified as buying opportunities. The high level of bullish sentiment from the AAII readings of the individual investor does not favor chasing the market at current levels. On the other hand, bearish sentiment from the Wall Street strategists is positive for the long-term.
Of course, the volume analysis also plays an important role and the recent low volume has kept many from participating in the recent move to new all time highs. This has been the case several times during this bull market but in each instance the on-balance volume (OBV) has given positive signals keeping traders on the right side of the market.
Therefore, I think a look at the current monthly OBV analysis will help prepare us as we start a new month of trading.
Chart Analysis: The Spyder Trust (SPY) dropped slightly below July’s low of $192.97 in early August as the quarterly pivot at $190.89 supported prices.
- The quarterly projected pivot resistance stands at $206.94.
- For September, the monthly starc- band is at $209.49.
- The monthly OBV rose above its WMA in July and stayed back above it until June of 2011.
- The monthly bottom formation was confirmed in July of 2012.
- The downtrend from the 2007 highs, line b, was broken at the end of 2012.
- The OBV is very close to making a new high again in August.
- The OBV is well above its rising WMA with major support at line c.
- The weekly OBV (not shown) did make a convincing new high in August.
- Based on the August 28 close, the monthly pivot in September will be at $197.19 with monthly projected pivot support at $193.59.
The PowerShares QQQ Trust (QQQ) has been leading the stock market higher since the April low of $83.06. It is up around 19.7% since those lows.
- The quarterly projected pivot resistance is at $101.45.
- It is much closer to the monthly starc+ band, which, in September, will be at $101.87.
- The preliminary pivot resistance for the new month is at $103.45.
- The monthly relative performance dropped back to its WMA in April.
- It has since broken out to new highs as resistance, at line f, was overcome.
- The bullish divergence at the 2009 low, line g, identified the Nasdaq 100 as a market leading sector for the new bull market.
- The monthly OBV dropped back to its rising WMA in April and has made another new high this month.
- The OBV had broken through major resistance, line h, at the end of 2013.
- The monthly pivot for September is at $97.67 with monthly pivot support at $95.65.
- The weekly OBV (not shown) has made significant new highs in August.
NEXT PAGE: Monthly OBV Analysis of an ETF and the 30 Year T-Bond Futures
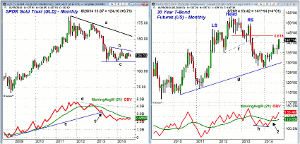
|pagebreak|The SPDR Gold Trust (SPY) has been forming a flag formation since June 2013, lines b and c.
- This is a negative formation as—after the sharp decline from the late 2012 highs—this appears to be a continuation pattern.
- The 127.2% Fibonacci retracement target is now at $108.54.
- The width of the formation has downside targets in the $107-$109 area.
- The monthly OBV broke the uptrend from the 2008 lows (line e) in early 2013.
- The OBV is trying to hold up but is still slightly below its WMA.
- The OBV has major resistance at the downtrend, line d.
- For September, the monthly pivot resistance is at $126.45.
- There is more important resistance at $129.21, which was the early July high.
The 30 Year T-Bond Futures have had a great month as the chart of the futures shows a strong monthly close.
- The T-Bonds completed the H&S top formation in May 2013 as the futures closed below the neckline, line f.
- In late 2013, the T-bonds hit a low of just above 128, which was above the H&S target in the 122 area.
- The T-Bonds are still below the major 61.8% Fibonacci retracement resistance at 143 16/32.
- This is quite close to the quarterly pivot resistance at 143 13/32 and these are the key levels to watch.
- The monthly OBV formed lower lows in early 2014, line h, which did not suggest an important low was forming.
- The OBV moved back above its WMA at the end of April.
- The OBV is still rising strongly and looks quite positive.
- There is first support now in the 138-139 area with the quarterly pivot at 136.
What it Means: The stock market clearly looks positive basis both the monthly and weekly analysis. This does favor higher stock prices into the end of the year. I will be watching the weekly OBV analysis as we head into the fall months for any signs that the rally is stalling.
The outlook for both gold and the gold miners is looking more negative. Both the weekly and daily charts show apparent continuation patterns, which are most likely to be resolved by another push to the downside.
Interest rates have dropped more than I expected at the start of the year but the T-Bond futures need a strong close above the 61.8% Fibonacci resistance to confirm that the decline from the 2012 high is really over.
How to Profit: No new recommendation.


